
In the Pacific Northwest into northern California, areas of heavy rain for the coastal ranges and heavy snowfall over the higher elevations of the Cascades are expected into Friday. Dry and windy conditions may produce elevated fire weather conditions in the central and southern High Plains and the Upper Midwest. Windy conditions and scattered rain and snow showers will continue in the Northeast. Read More >
 Email the authors
I. Introduction
The remnants of tropical cyclone Debby brought significant meteorological and hydrological impacts to Vermont and northern New York on 9-10 August 2024. This writeup provides a summary of those impacts - including damaging winds, flash flooding, and river flooding - along with their associated environmental conditions. This writeup is organized as follows. Observations and conditions associated with the damaging winds and power outages are covered in Section 2. A similar analysis focused on river and flash flood conditions is covered in Section 3.
II. Damaging Winds
In this section we will focus on the gusty southerly winds and associated widespread power outages that occurred on the evening of August 9th, as the remnants of tropical cyclone Debby impacted our region. Another potential write up will examine the ingredients and impacts associated with the heavy rainfall that occurred over northern New York, specifically the St. Lawrence Valley area.
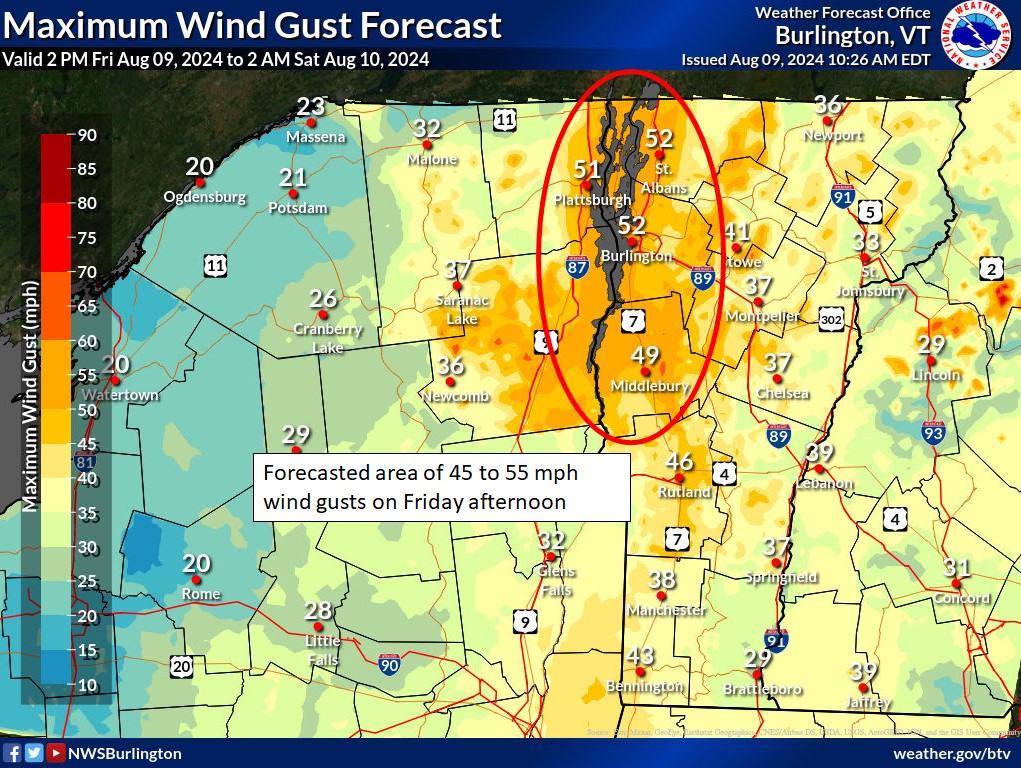
The remnants of tropical cyclone Debby tracked from south-central Pennsylvania on the morning of August 9th to near Montreal, Canada by 8 PM that evening, while strengthening into an extratropical system with a sea level pressure of 996 mb. The combination of deepening surface low pressure, a strengthening southerly low-level jet, and the south to north orientation of the Champlain Valley helped to enhance winds that produced widespread tree damage and power outages across the region. In addition, the saturated soils and leaf out, along with slightly stronger winds than forecasted, caused more damage than anticipated across our region. Figure 1 shows the forecasted maximum wind gusts of 45 to 55 mph on 09 August 2024 versus observed maximum wind gusts of 50 to 60 mph that occurred. The Burlington International Airport (BTV) gusted to 62 mph, while a gust to 51 mph was measured at Plattsburgh International Airport. The gust to 62 mph at BTV ties for the 7th highest gust on record at the site, and the highest observed in the month of August.
Away from the primary weather observation locations at airports, it should be noted some of the highest gusts may not have been well captured due to the loss of power.
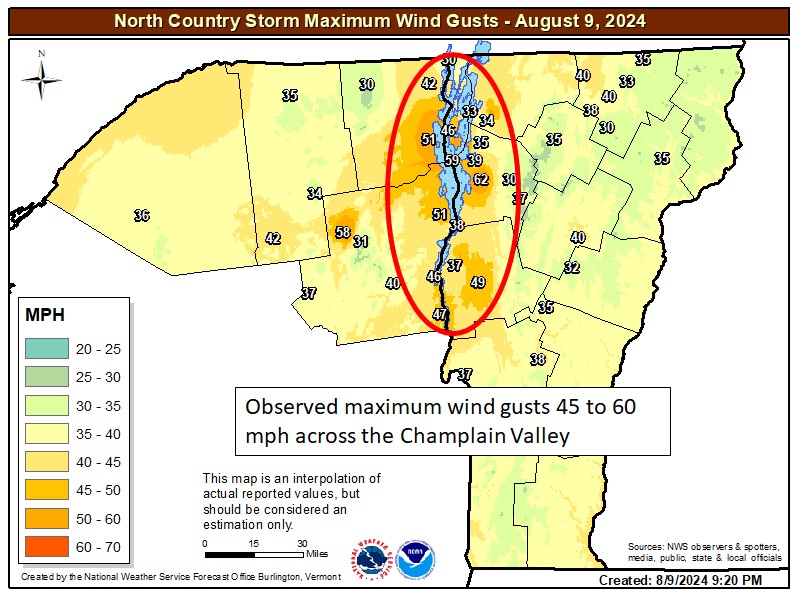
The most concentrated area of damage was across the central and northern Champlain Valley and western slopes of the Green Mountains during the evening hours on August 9th, 2024. However, damage and power outages also occurred across parts of northern New York as well as central and northern Vermont. Figure 2 shows a graph of power outages across Vermont during the event, which peaked at over 50,000 customers around 9 PM EDT.
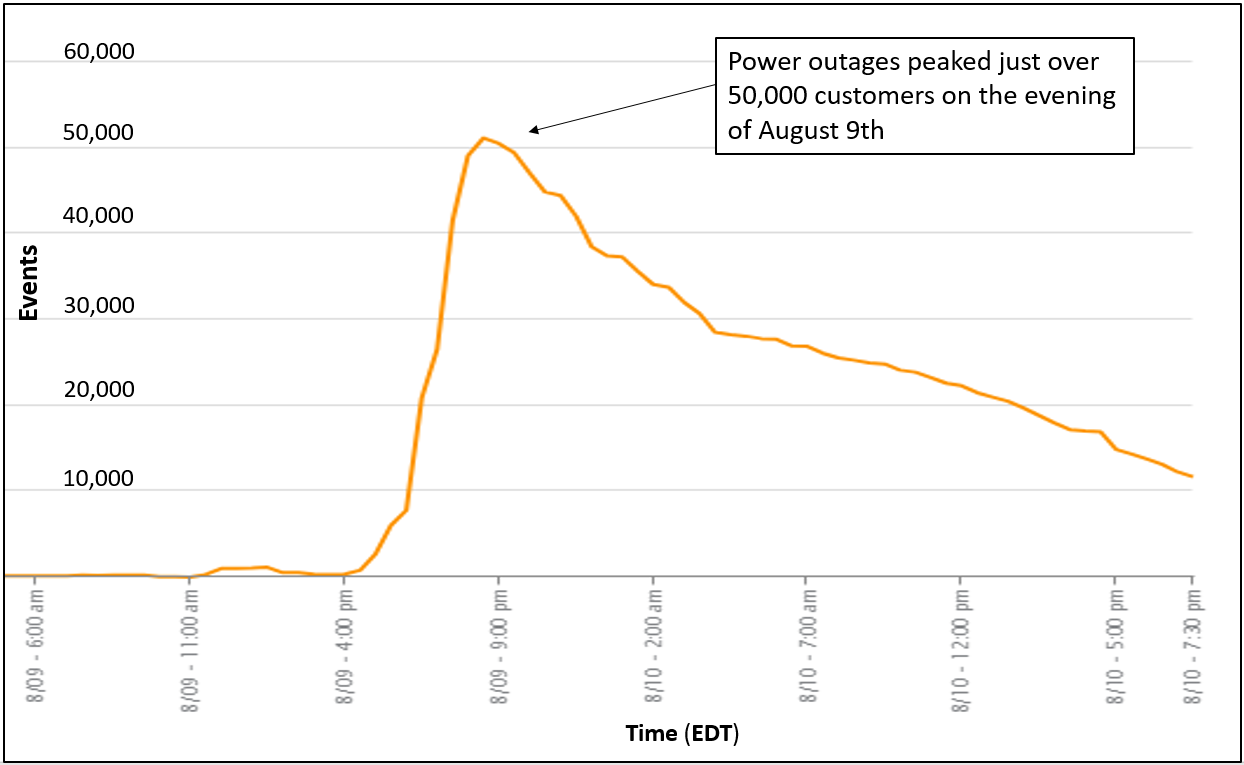
Figure 2: Power outage graph from August 8th through August 10th across Vermont. Data provided by Green Mountain Power.[click to enlarge]
The surface analysis from 8 AM through 8 PM EDT on August 9th showed a strengthening area of low pressure associated with extratropical cyclone Debby. Sea level pressure went from 1003 mb in southwest Pennsylvania to 996 mb by 8 PM just north of Rouses Point, New York. Figure 3 shows the sea level pressure evolution on August 9th associated with the remnants of tropical cyclone Debby. This deepening area of low pressure, combined with an approaching cold front and channeled southerly flow helped to enhance the damaging wind fields across northern New York and Vermont, especially across the northern Champlain Valley.
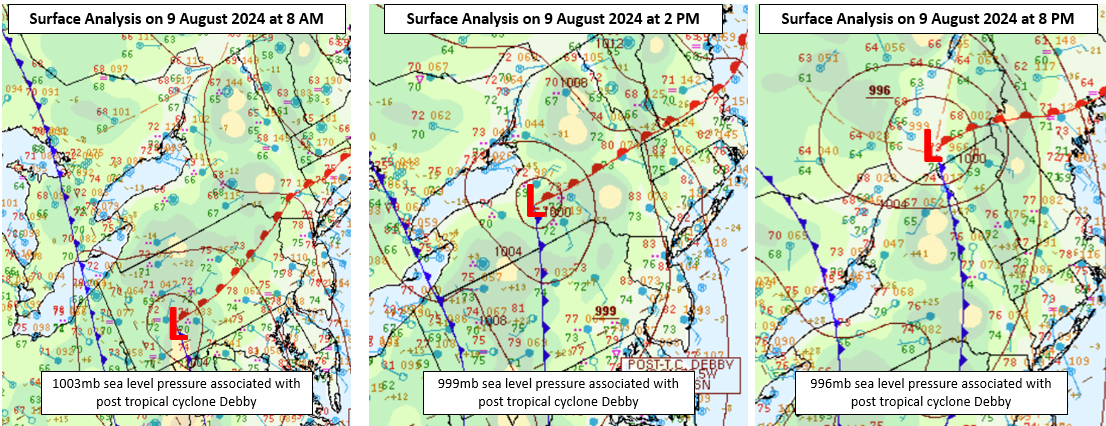
Figure 3: Sea-level pressure analysis (in millibars, with a 4 millibar contour interval) from 8 AM to 8 PM EDT on 09 August 2024.[click to enlarge]
A key parameter utilized by forecasters to determine potential gusty winds is the surface map, along with a 2 hour pressure rise and fall analysis. The sharper and greater the magnitude of this couplet in the surface pressure analysis, the higher potential there is for damaging wind gusts greater than 50 mph. Figure 4 shows the surface analysis on 09 August 2024 at 8 PM EDT, along with the 2-hour pressure change field. This sharp pressure rise/fall couplet was enhanced over northern New York and Vermont as a result of deepening surface low pressure and the trailing cold front associated with extratropical cyclone Debby.
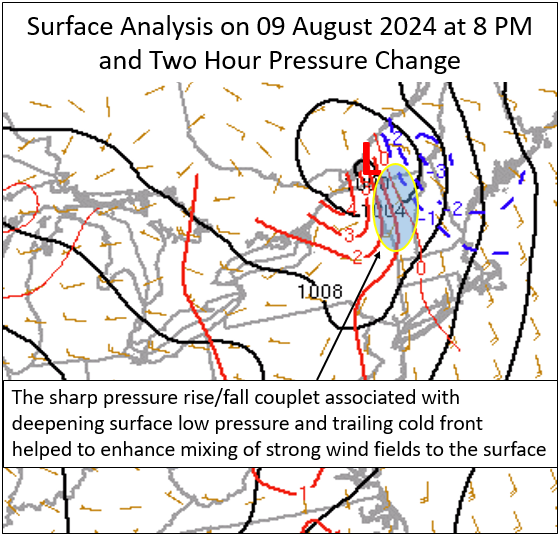
Figure 4: Sea level pressure analysis (black lines) with 2 hour pressure rise (red lines) and fall (blue dotted lines) and surface wind barbs (brown arrows) on 09 August 2024 at 8 PM.[click to enlarge]
Another helpful tool utilized by forecasters is examining atmospheric sounding profiles for multiple locations throughout the region. Figure 5 below shows the NAM 3-km sounding at Burlington, VT on 09 August 2024 at 9 PM. The sounding profile showed the bottom of the mixed layer wind of 51 knots or 59 mph, which provides forecasters with a potential wind gust if mixing is favorable to transfer this wind to the surface. In this case a developing dry slot and breaks in the precipitation, helped to mix these stronger winds around 1500 above ground level toward the surface, resulting in wind gusts 40 to 60 mph across our region. If greater mixing were to happen with warmer surface temperatures, higher wind speeds up to category 1 hurricane force could have resulted across our area, given the top of the mixed layer winds of 70 to 75 knots. The vertical wind profile (Fig. 5) shows rapidly increasing winds between 925mb and 850mb of 60 to 80 knots, which is highlighted on the right side of the sounding diagram.
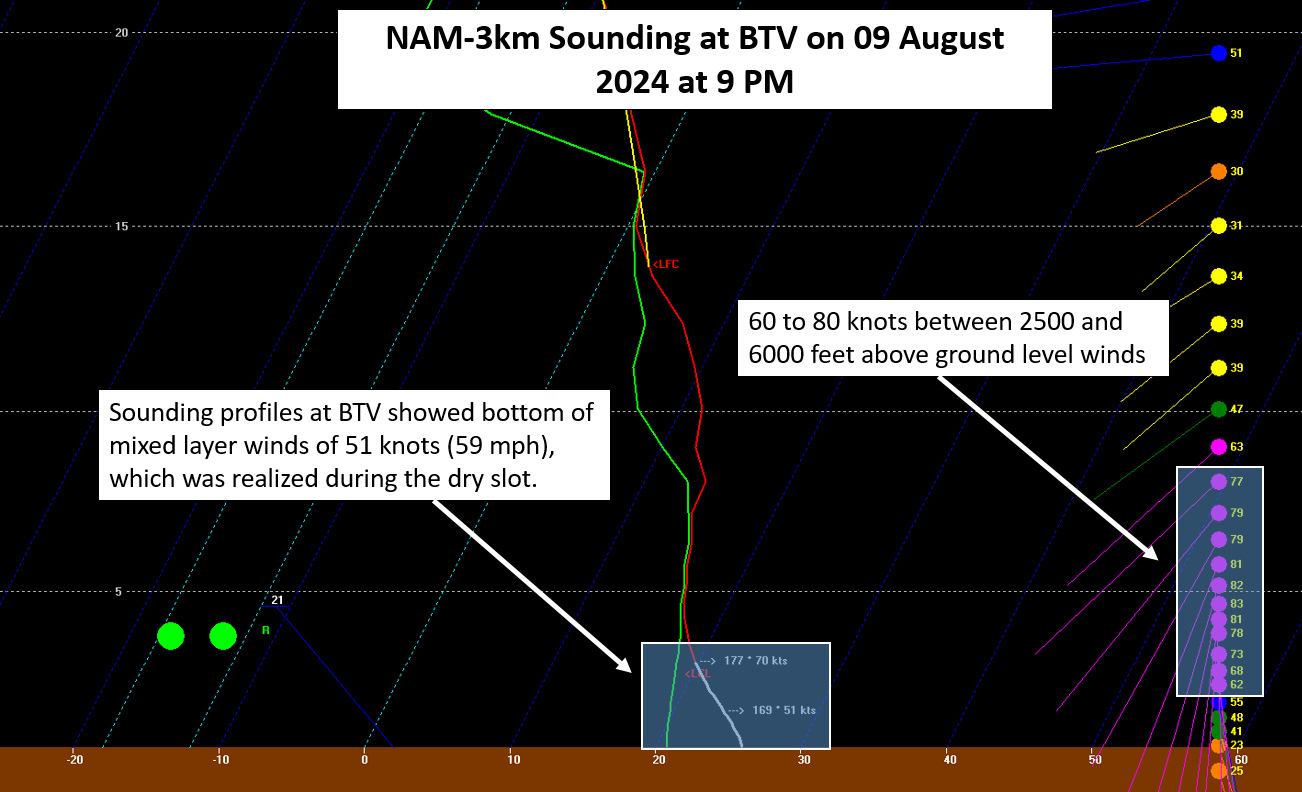
Figure 5: Bufkit NAM 3-km sounding at Burlington, VT on 09 August 2024 at 9 PM EDT.[click to enlarge]
The Weather, Research and Forecasting Advanced Research Weather Model (WRF-ARW) progged composite reflectivity indicated the heavier rain showers along the surface cold front were going to become more scattered in nature toward the evening hours, allowing for better mixing of winds between 1500 and 2500 feet above ground level toward the surface. These robust convective elements and associated very strong wind fields produced localized bursts of stronger wind gusts, especially across the Champlain Valley and western slopes of the Green Mountains during the evening hours on August 9th. Figure 6 below shows the WRF-ARW progged surface analysis (black lines) with radar composite reflectivity (color image) (left image) and 850mb heights (black lines) and wind fields (color image) (right image) at 8 PM on 9 August 2024.
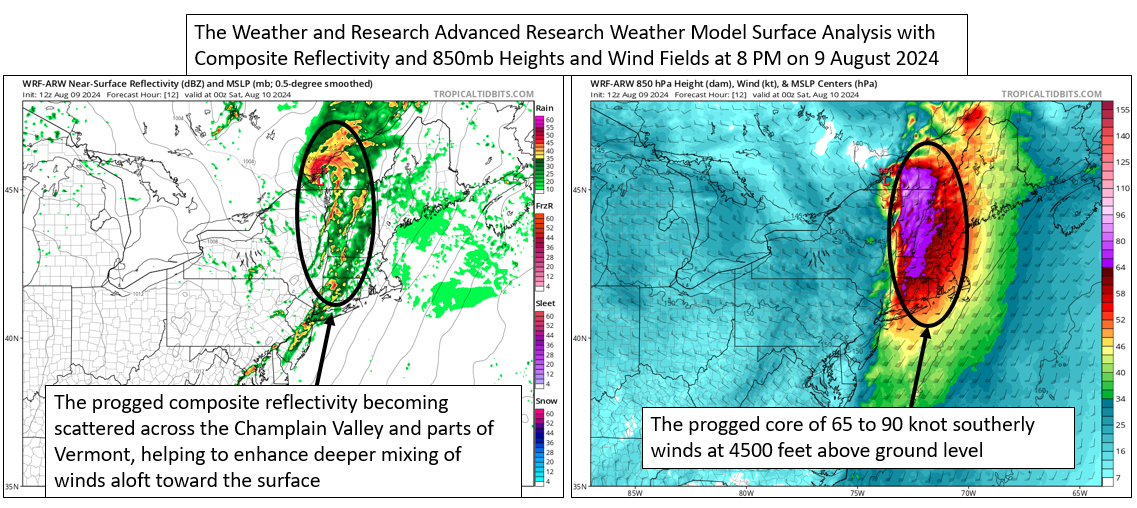
Figure 6: The Weather, Research and Forecasting-Advanced Research Weather Model (WRF-ARW) progged surface analysis (black lines) with radar composite reflectivity (color image) (left image) and 850mb heights (black lines) and wind fields (color image) (right image) at 8 PM on 9 August 2024.[click to enlarge]
The High Resolution Ensemble Forecast (HREF) 10-meter above ground level wind gust output is another very helpful tool in determining timing, location, and potential wind gust speeds during potential impactful wind events. Figure 7 below is the HREF 10 meter above ground level gust (mph) ensemble mean (color image) valid at 9 PM on 09 August 2024. The guidance was 2 to 3 hours too slow in highlighting the region of strongest winds, as most damaging gusts occurred between 5 PM and 8 PM on the 9th, but the HREF did a good job forecasting potential wind gust speeds of 45 to 55 (orange/redish color) mph over the Champlain Valley, with a small area of 60 mph possible in western Franklin County, VT (red color). The aerial coverage progged by the HREF was also a bit overdone, based on surface observations across central and northern Vermont, as the highest gusts were mostly concentrated over the Champlain Valley, western slopes of the Green Mountains, and exposed higher terrain of central/northern Vermont Mountains.
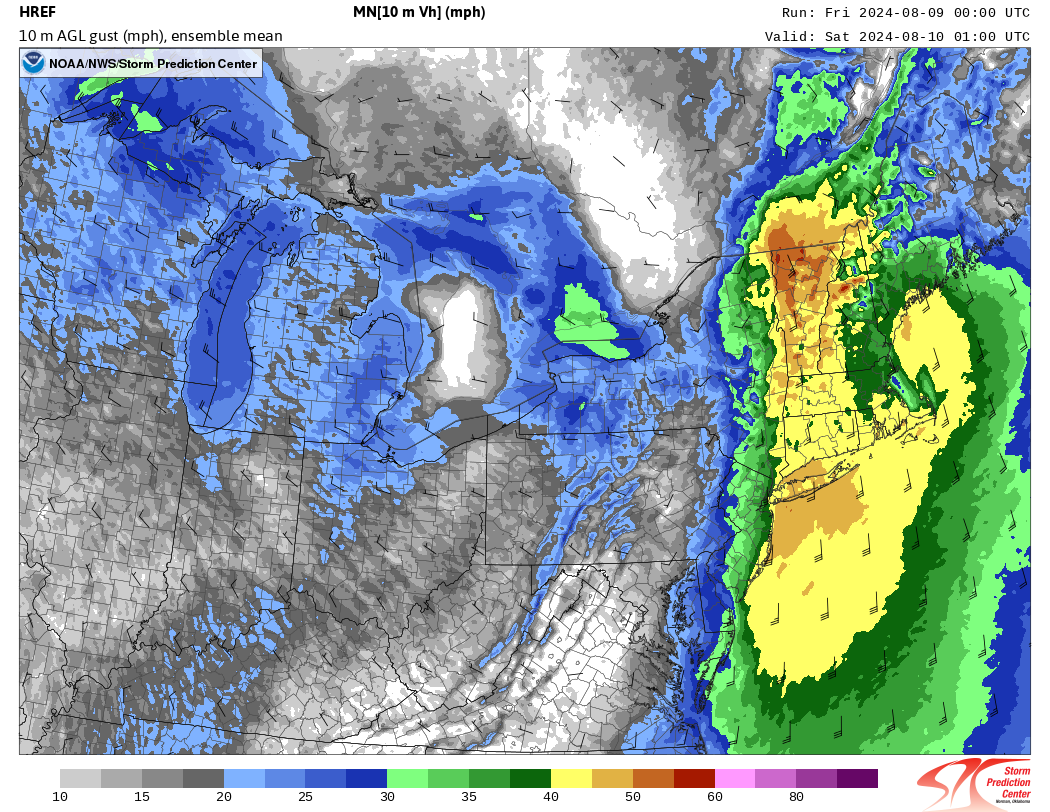
Figure 7: The High Resolution Ensemble Forecast (HREF) 10 meter above ground level gust (mph) ensemble mean (color image) valid at 9 PM on 09 August 2024. (Courtesy NCEP/Storm Prediction Center)[click to enlarge]
The KCXX velocity sampling highlighted very well the enhanced wind speeds in the Champlain Valley and portions of the western slopes of the Green Mountains during the evening hours on August 9th (Fig. 8). The pink, yellow and orange colors indicated outbound velocities of 40 to 60 knots with an enhanced area of higher winds in the northern Champlain Valley of 60 to 80 knots, as the beam sampling increases above the ground. Meanwhile, the lighter and darker shades of blue in the image below shows inbound velocities of 60 knots or higher across the central and southern portions of the Champlain Valley and western slopes east of Middlbury. The south to north orientation of the Champlain Valley helped to channel higher winds across the valley and this combined with leaf out and saturated soils produced widespread power outages and tree damage in this area. Figure 8 shows the KCXX 0.9o velocity at 6:01 PM EDT on 09 August 2024. We showed the 0.9° elevation scan as the 0.5° scans had poor velocity sampling due to ground clutter and range folding issues associated with the propagating radar pulse.
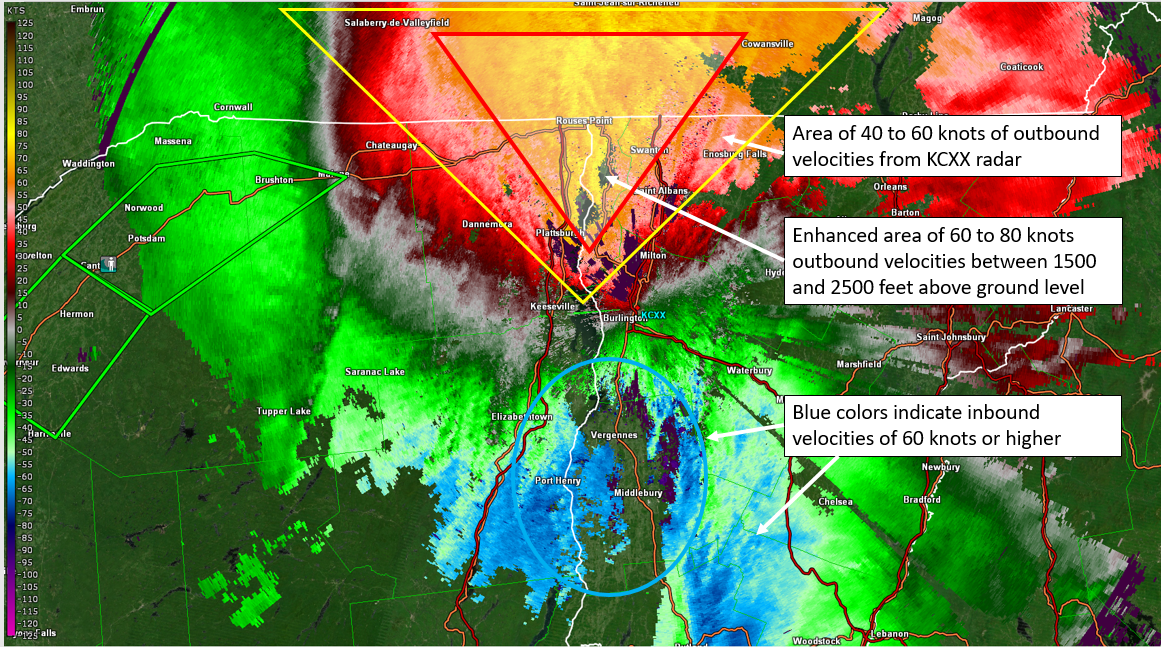
Figure 8: KCXX 0.9° velocity at 6:01 PM on 09 August 2024.[click to enlarge]
The GOES-16 mid-level water vapor loop from 5:16 PM to 8:56 PM (Fig. 9) showed a well defined and rapidly developing mid level dry slot moving across our region. This pocket of dry air coincided with the core of strongest 925mb to 850mb wind fields to help transfer the stronger winds aloft toward the surface as temperatures warmed into the 70s across the area. The dry air was associated with subsidence behind potent short wave energy and resulted in the steadier/heavier precipitation fields to become more scattered in nature. The breaks in precipitation and holes in the overcast skies, helped to destabilize the lowest 1500 feet of the atmosphere to promote localized bursts of winds aloft mixing toward the surface. These bursts caused a large fluctuation in wind gusts, resulting in greater damage to trees and power lines.
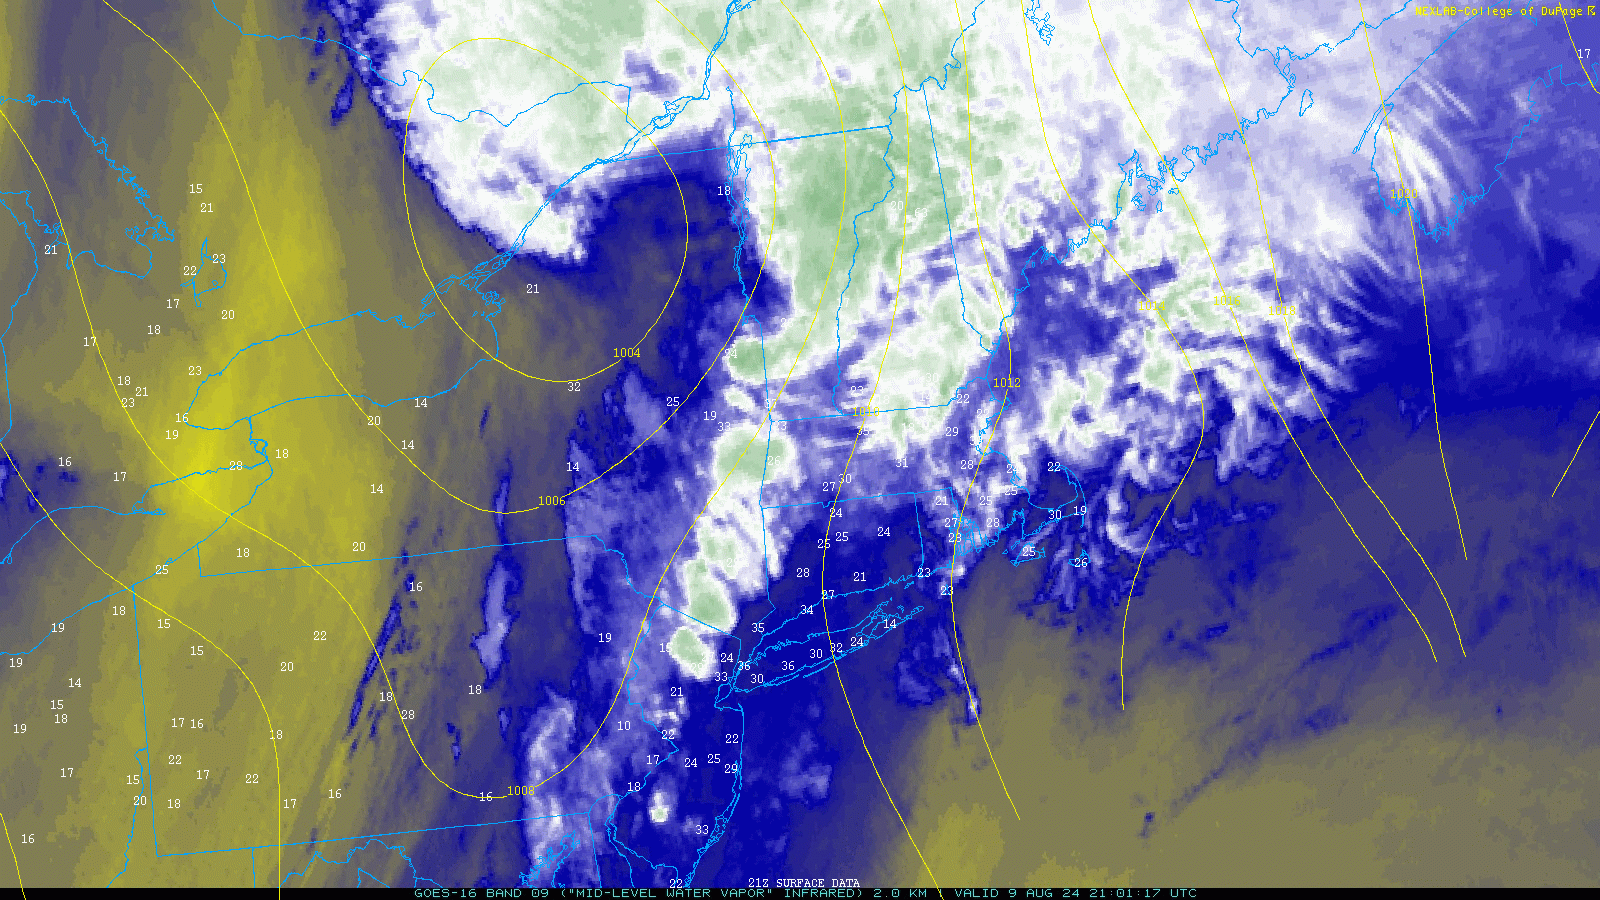
Figure 9: GOES-16 mid-level water vapor loop from 5:16 PM to 8:56 PM with surface analysis (yellow line) and wind gusts (knots) on 9 August 2024.[click to enlarge]
In conclusion, this very dynamic and complex system associated with posttropical cyclone Debby provided the North Country with very heavy rainfall and flash flooding over northern New York, while other parts from the eastern Adirondacks to the central and northern Green Mountains, including the Champlain Valley experienced damaging winds. The complex topography and localized channeling effects helped to enhance wind gusts of 40 to 60 mph across the central and northern Champlain Valley on the evening of August 9th. In general the NWS BTV slightly under-forecasted the wind gusts and could have messaged the potential the impacts for widespread power outages and tree damage due to saturated soils and leaf out a little better. Furthermore, we may have also been too focused on the potential for flooding, given the history this summer. In the future, we will take lessons learned from this event and provide continued improvements to our messaging and the products and services we produce for our users, including the emergency management community. Figures 10 and 11 below highlight some of the damage that occurred in many towns and communities across the North Country during this high wind event.
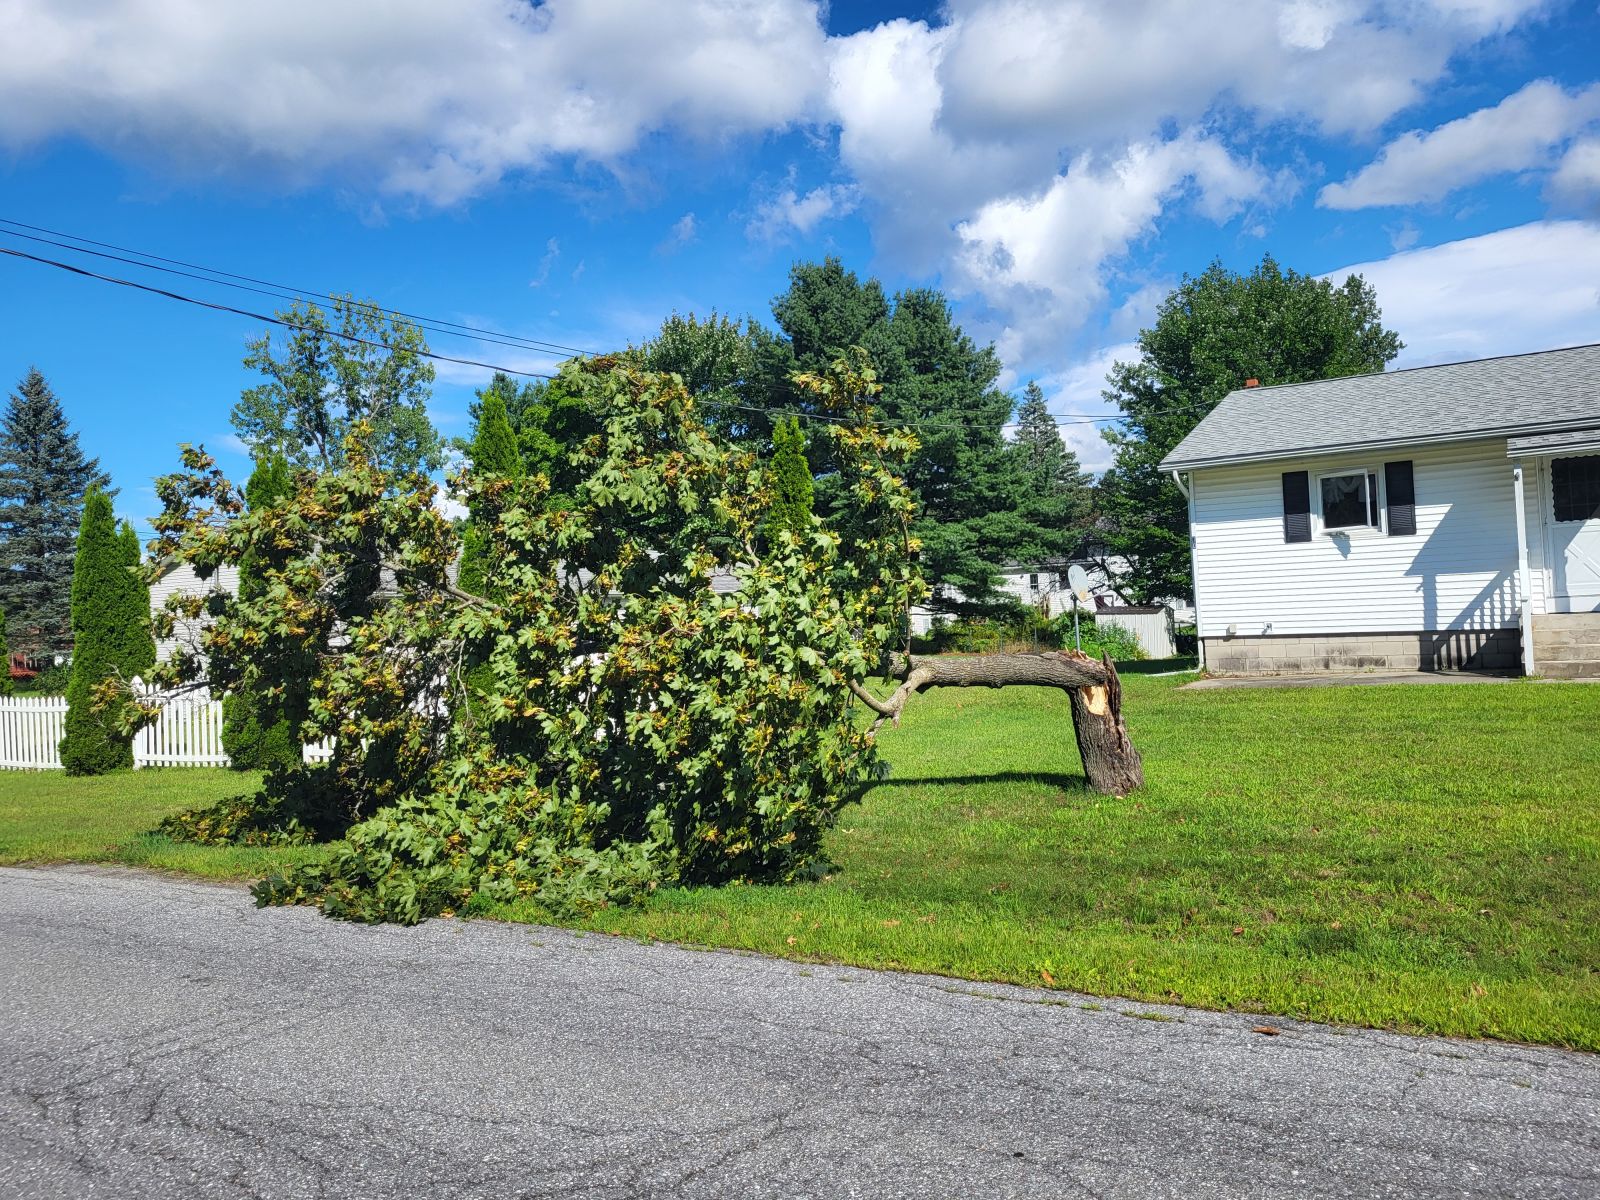
Figure 10: A maple tree snapped off near the trunk in the Town of Milton, VT on 9 August 2024. Photo courtesy of Brooke Taber NWS BTV.[click to enlarge]
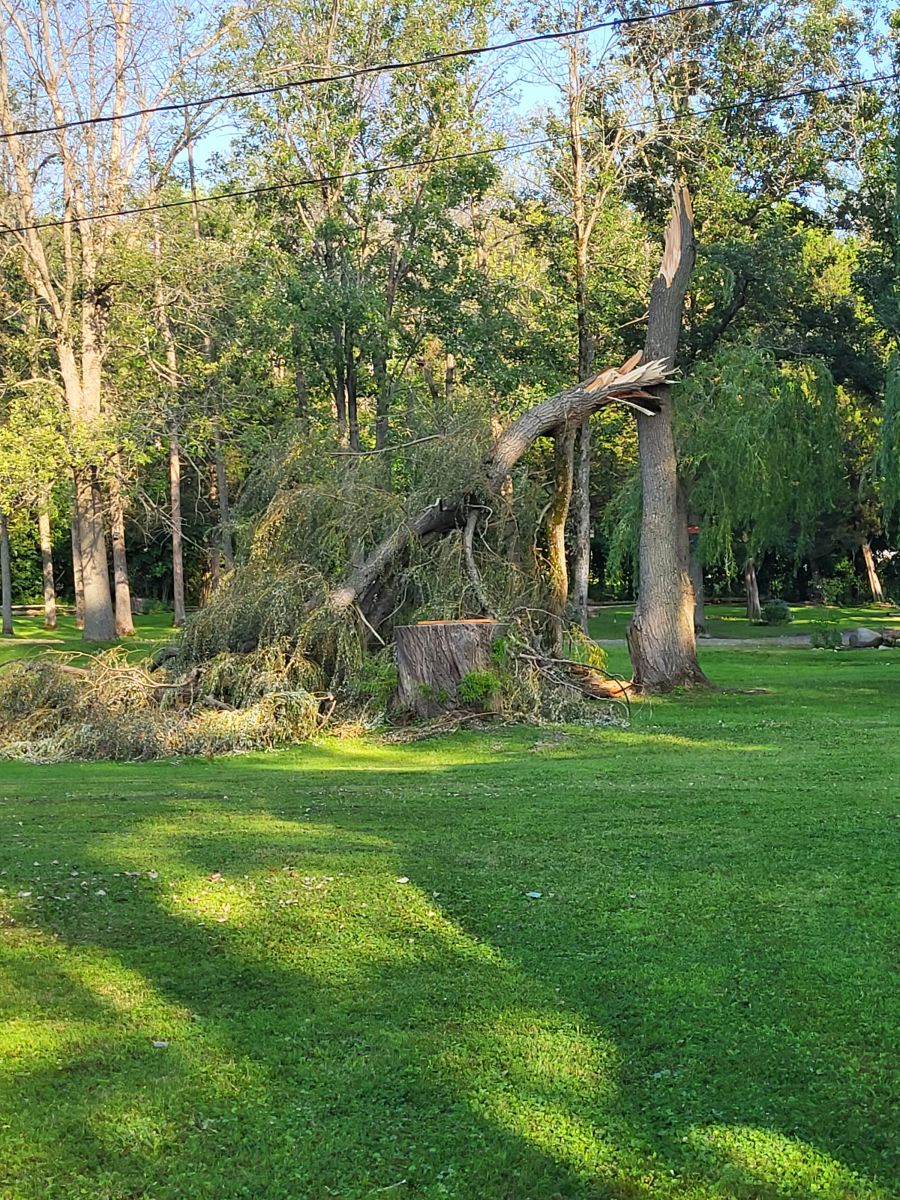
Figure 11: A large willow tree snapped off 2 miles north of North Hero, VT on 09 August 2024. Photo courtesy of Brooke Taber NWS BTV.[click to enlarge]
III. Riverine and Flash Flooding in the St. Lawrence Valley
As the remnants of Tropical Storm Debby tracked through our region, widespread flooding also occurred across portions of the St. Lawrence Valley, where over 60 roads were flooded or damaged, property inundated and several high-water rescues performed. States of Emergency were declared for many counties in New York due to the flooding from this event, including St. Lawrence County.
The St. Lawrence Valley, while not immune to flooding episodes, is typically less susceptible to more widespread, significant high water effects due to its gently rolling terrain and slow-moving rivers which can handle larger flows. Many of its rivers are also heavily hydro-regulated, with large power dams impounding significant percentages of runoff from heavy rainfall events. However, excessive rainfall with flooding can and does occur, which was the case during this event when the remnants of Debby tracked across the region (Fig. 12).
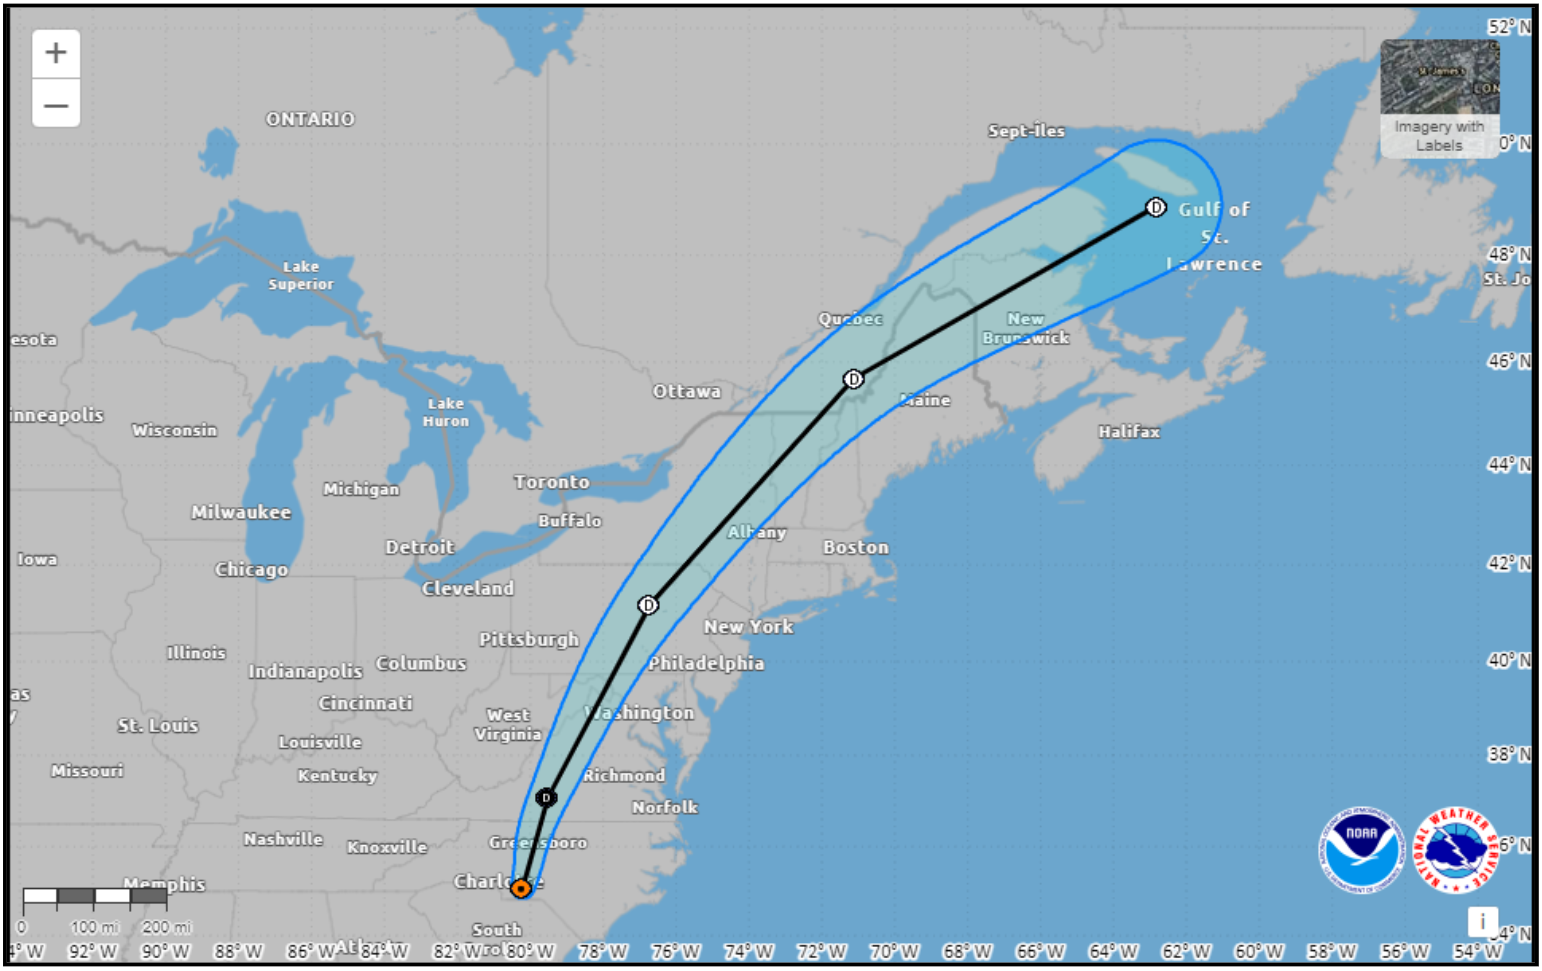
Figure 12: NWS/NCEP/National Hurricane Center track of TS Debby as the storm recurved northeast through the region on August 9, 2024.[click to enlarge]
One predictable and often-observed feature of rainfall distribution patterns in extra-tropical transition of tropical cyclones is the tendency of the primary precipitation shield to shift north and west of the surface low track as the storm recurves north-northeastward into the mean westerlies. This phenomenon has been well documented in meteorological literature and also occurred during this event, with an observed 50-70 mile wide swath of excessive rainfall across St. Lawrence and northwestern Franklin Counties in New York. In this band, rainfall totals averaged from three to as much as seven inches with heaviest reported totals of 7.35 inches in North Lawrence, NY and 7.10 inches in Emeryville, NY (Fig. 13). For a complete list of rainfall totals, please click here.
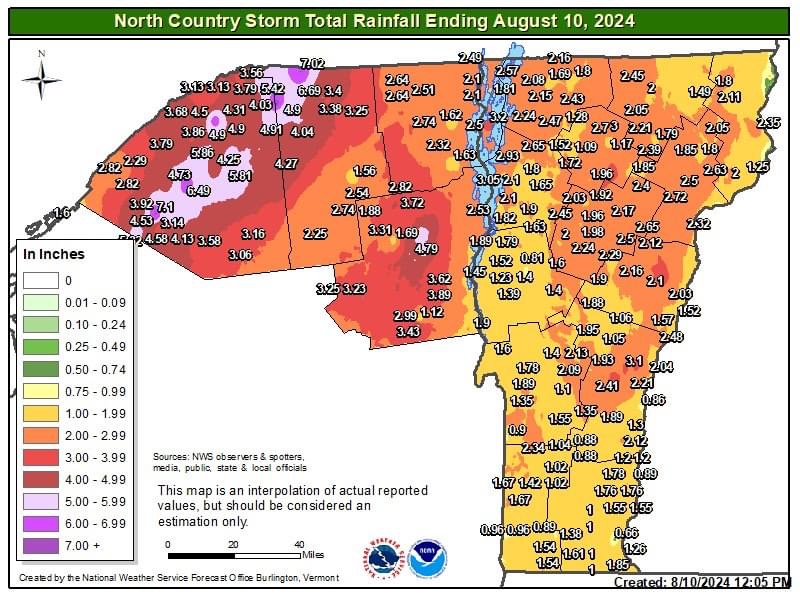
Figure 13: Storm total rainfall (in inches) from the remnants of Tropical Storm Debby. Heaviest totals from three to in excess of seven inches were observed in a 50-70 mile swath across portions of St. Lawrence and northwest Franklin Counties in northern New York.[click to enlarge]
One aspect of this event was the impressive rainfall rates observed in the core of the heaviest precipitation swath. Within this band, precipitable water (PWAT) values, or the amount of water held in the atmospheric water column, ranged from 2.1 to 2.4 inches. These values approached record levels for the date as interpreted by the NOAA/NWS Storm Prediction Center's Atmospheric Sounding Archive, using Albany, NY as a closest proxy (Fig. 14).
Another feature observed in this band, and one that is common in tropical air masses around the world is an atmospheric phenomenon known as warm rain processes. Under these conditions, the distribution of rainfall drop size is focused toward a larger percentage of smaller drops as opposed to a more uniform mix of large and small drops in standard continental rainfall (i.e. a standard thunderstorm in the summer). During these conditions, the freezing levels in the atmosphere are understandably quite a bit higher than normal, usually in excess of 10,000 feet for our region. As such, the large and dense clustering of small rain drops lead to very efficient rainfall accumulations. This is exactly what was observed in the heavy rainfall swath where observed rates neared, or approached two inches per hour. Shown in Figure 15, the Massena, NY atmospheric sounding profile from the Rapid Refresh Model at 20 UTC (4:00 PM EDT) on August 9 showed a nearly saturated airmass to 25,000 feet, a precipitable water of 2.35 inches and a warm cloud depth (or freezing level) of 14, 028 feet, all extremely high for our area.
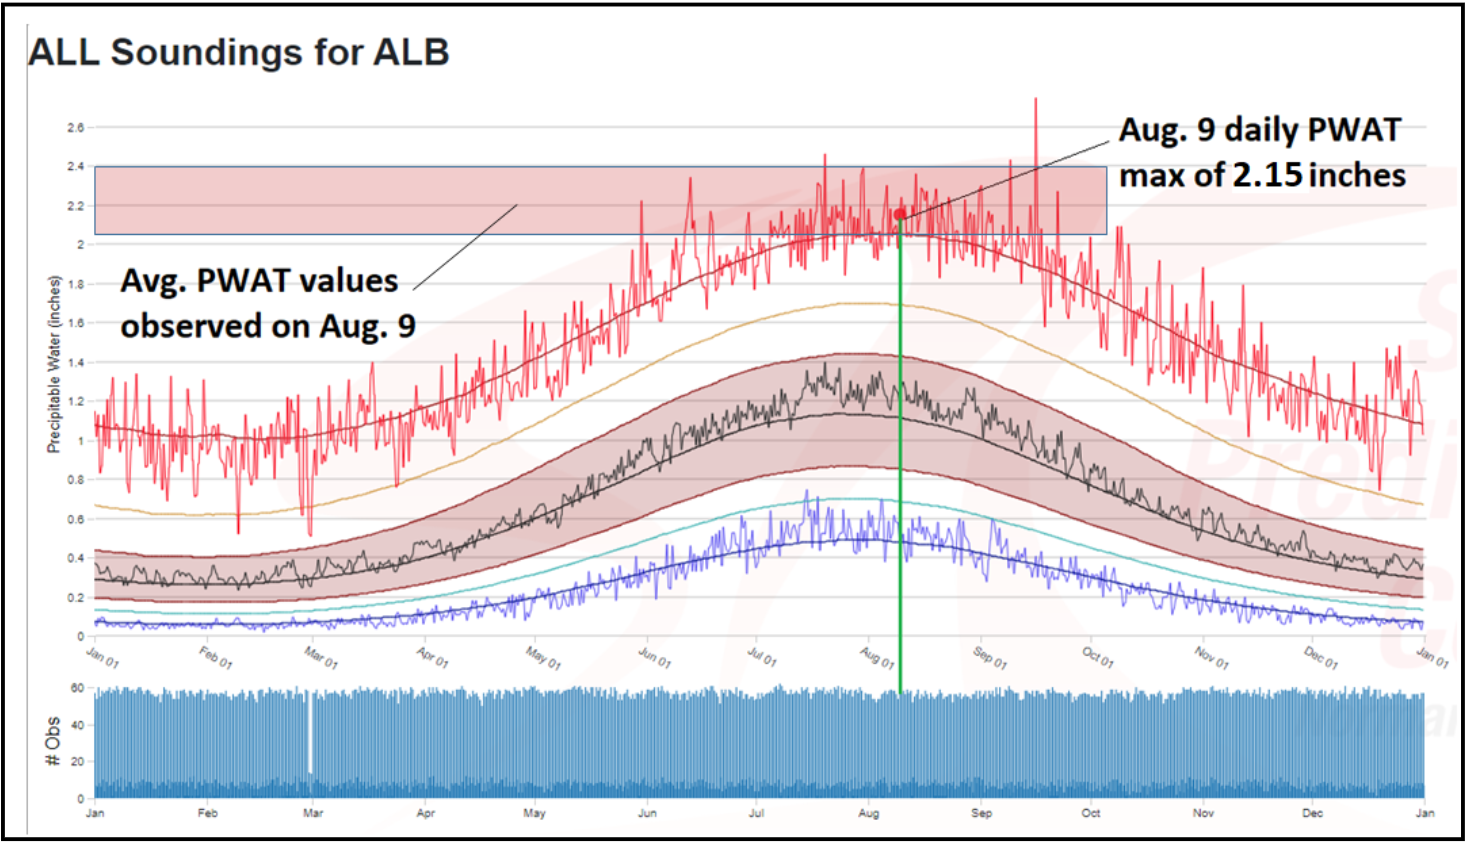
Figure 14: NOAA/NWS/Storm Prediction Center's precipitable water (PWAT) climatology analysis for Albany, NY at 15 UTC. At 15 UTC on August 9, 2024, PWAT values across the St. Lawrence Valley ranged from 2.1 to 2.4 inches (red shading at top), which ranks near or above record values for the date.[click to enlarge]
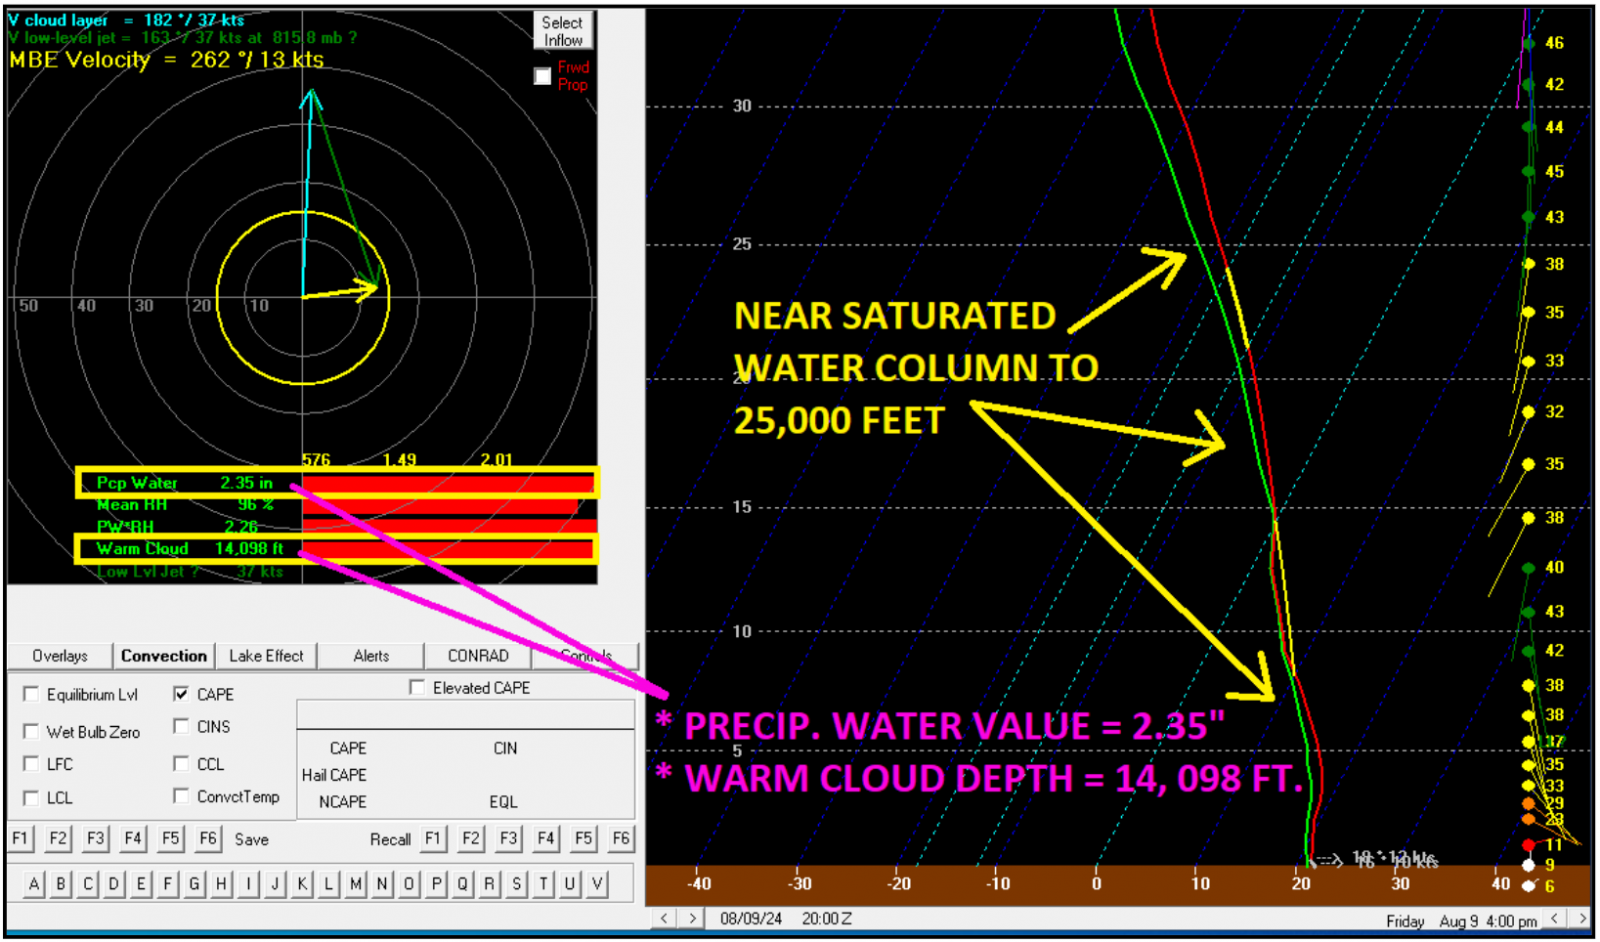
Figure 15: Thermodynamic sounding profile from the Rapid Refresh Model (RAP) for Massena, NY at 20 UTC (4:00 PM EDT) on August 9, 2024 showing PWAT values to 2.35 inches, a Warm Cloud Depth (freezing level) of 14, 098 feet, and a near saturated atmospheric column to 25,000 feet.[click to enlarge]
In the core of the heavy rainfall swath, numerous instances of flash, or poor drainage flooding were observed across St. Lawrence and Franklin Counties. Some of the more extensive damage was observed in areas around Colton, Hermon and Russell, though scattered flash flooding reports extended from the Lewis/Jefferson County border in the south all the way to the Canadian border at Akwesasne and Fort Covington in the north (Figs. 16 and 17). East of the Route 11 corridor south of Canton, the terrain is slightly hillier than in areas closer to the St. Lawrence River proper, so its susceptibility to flash flooding was somewhat higher in this instance.
Given the magnitude of the event, mainstem rivers were also not immune to flooding. This included, but was not limited to stretches of the St. Regis, Raquette, Grass and Little Salmon Rivers along which many instances of high water flooding were observed. Some of these rivers remained in a high flow state for several days following the heavy rainfall, as floodwater runoff gradually filtered through the region (Fig. 18).
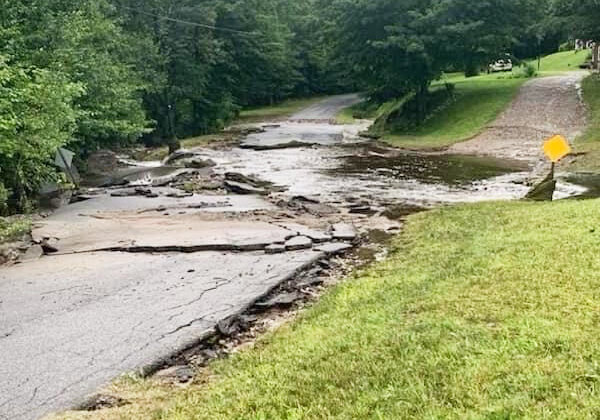
Figure 16: Damage to Dana Hill Road in Russell, NY after nearly six inches of rain overwhelmed local creeks and streams (photo courtesy North Country Now).[click to enlarge]
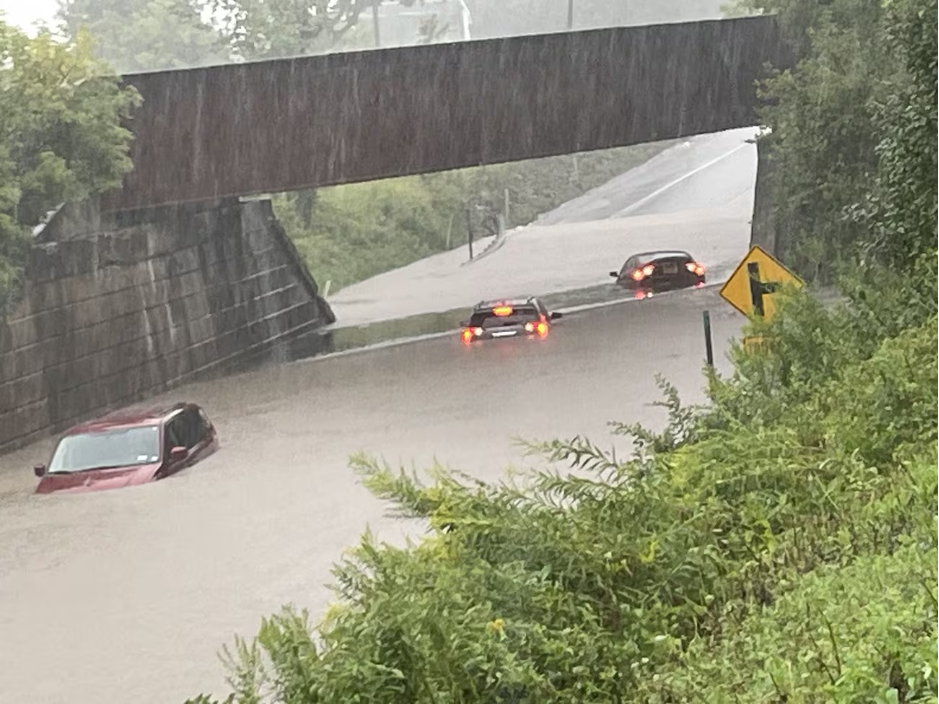
Figure 17: Stalled and stranded cars shown at the CSX railway bridge at Route 11 just east of Canton, NY on August 9, 2024 (Photo courtesy WWNY-TV).[click to enlarge]
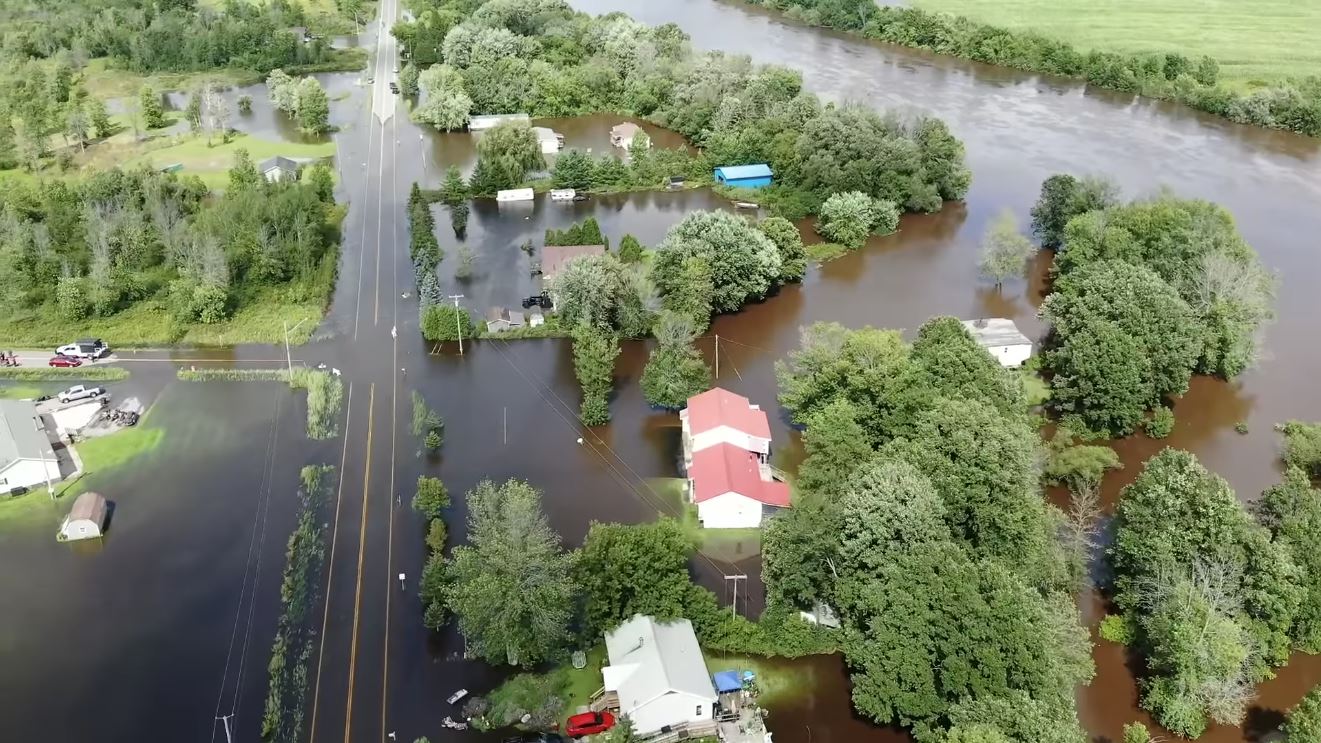
Figure 18: High water on the St. Regis River floods local residences in Hogansburg, NY on 10 August 2024 (Photo courtesy St. Regis Mohawk Tribal Police. Click here for the video.).[click to enlarge]

