 Email the author
On 12 July 2022 a line of severe thunderstorms developed across the southern Champlain Valley and impacted central-southern Vermont with scattered damaging thunderstorm wind gusts. The primary focus of damage was across Rutland and Windsor counties, with additional isolated damage in the St. Lawrence Valley and northern Champlain Valley. At the peak over 10,000 customers were without power across Vermont, with many reports of trees and power lines down. Figure 1 below shows the Day 1 Categorical Outlook from the Storm Prediction Center (SPC) issued at 9 AM on 12 July 2022, along with the wind and hail probability outlooks. The outlook highlighted the eastern Adirondacks into Vermont with a slight risk, with wind being the primary severe weather hazard. From SPC, a slight risk implies well-organized severe thunderstorms are expected, but in small numbers and/or low coverage. Depending on the size of the area, approximately 5-25 reports of 1 inch or larger hail, and/or 5-25 wind events, and/or 1-5 tornadoes would be possible. The probabilistic wind from SPC, showed a 15% chance of severe thunderstorm winds and 5% of severe hail within 25 miles of a given point during the outlook period.
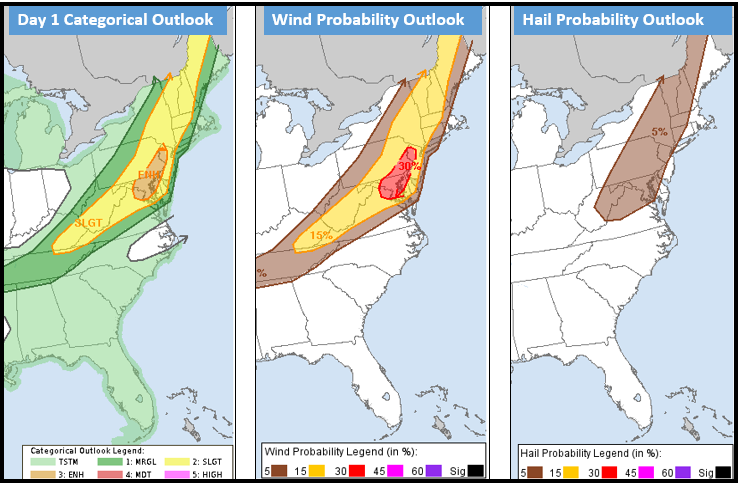
Figure 1: Storm Prediction Center (SPC) day 1 categorical outlook (left image), wind probability outlook (middle image), and hail probability outlook (right image) issued at 9 AM on 12 July 2022. [click to enlarge]
The SPC issued a mesoscale discussion at 1140 AM highlighting a severe thunderstorm watch was likely within the next couple of hours, due to the combination of approaching mid/upper level trough, mid-level flow of 45 to 55 knots, and Mean Layer CAPE (MLCAPE) of 1000-2000 J/kg across the area. The discussion mentioned surface convergence was weak and ill-defined, but deep layer shear parameters and adequate instability supported the potential for a few supercells with both hail and damaging wind threat, before the convection evolved into a line with damaging winds as the primary threat. At 1245 PM the SPC issued a severe thunderstorm watch, for the expectation of severe thunderstorms within the next 1 to 2 hours in and around the watch box. Figure 2 below shows the products issued by SPC.
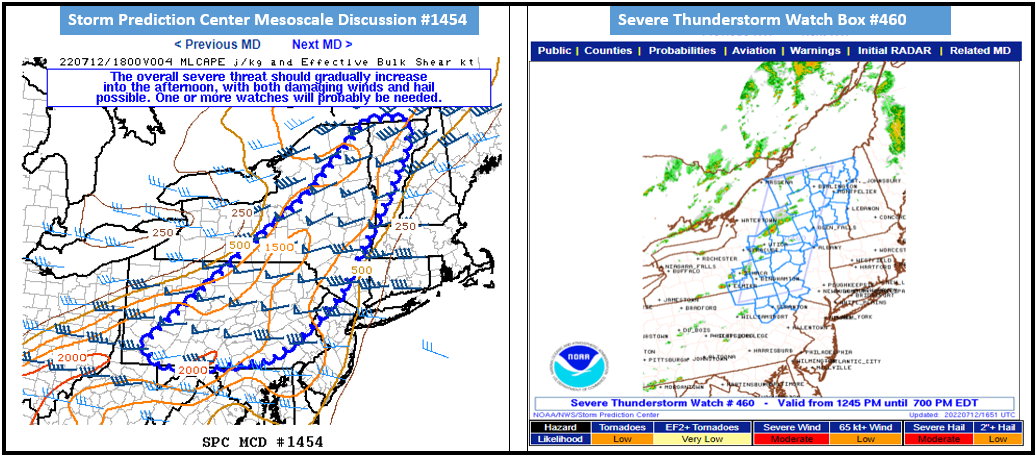
Figure 2: SPC mesoscale discussion #1454 (left image) and severe thunderstorm watch box #460 on 12 July 2022. [click to enlarge]
Figure 3 below shows the Buffalo, NY upper air sounding at 8 AM on 12 July 2022. The combination of surface temperatures in the 80s and dewpoints in the 60s, created surface based convective available potential energy (CAPE) values of 1700 J/kg, with a lifted index (LI) of -5°C (Celsius). CAPE values greater than 1500 J/kg, suggests a moderately unstable environment, favorable for thunderstorm development. The DCAPE (Downdraft CAPE) exceeded 1000 J/kg from the observed sounding, suggesting strong/gusty downdraft winds would be possible within deep convection. The larger the DCAPE values the greater potential for strong downdraft winds. In addition, the Buffalo sounding showed surface to 6km shear of 49 knots. This shear was a result of the approaching mid/upper level trough and the embedded jet streak of 850mb to 500mb winds of 35 to 65 knots. Thunderstorms tend to become more organized and persistent as vertical shear increases. Supercells and organized convection, such as squall lines with bow echoes are commonly associated with vertical shear values of 35-40 knots and greater through this depth. Given the very strong 850mb to 500mb flow and mainly a unidirectional wind component through a deep layer, damaging thunderstorm wind gusts were the primary severe weather threat.
The freezing level above 13,000 feet and high wet bulb zero heights, severe hail was not expected to be a significant impact. However, moderate CAPE profile and high equilibrium levels indicated thunderstorms would extend 35,000 to 40,000 feet into the atmosphere, and be capable of producing severe winds and localized heavy rainfall. The equilibrium level is the level at which the rising parcel equals the actual air temperature at that given height, and results in the rising parcel now becoming stable; it no longer accelerates upward. Finally, the sounding showed a precipitable water value of 1.4 inches, which suggests the potential for thunderstorms to produce very heavy rainfall. Precipitable water is the depth of the amount of water in a column of the atmosphere if all the water in that column were precipitated as rain. Values greater than 1.2 inches, suggests a greater potential for heavy rainfall, especially during the summertime.
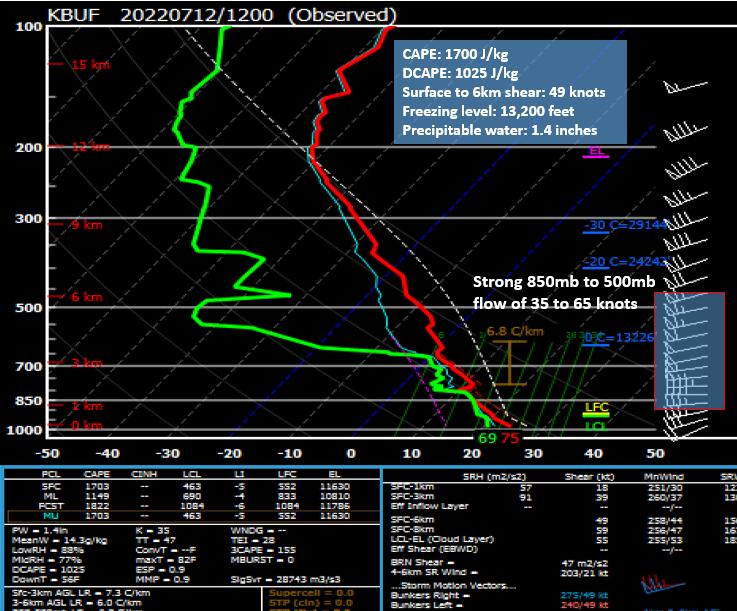
Figure 3: Upper air sounding from Buffalo, New York at 8 AM on 12 July 2022.[click to enlarge]
The 2 PM surface analysis showed a weak cold front slicing across the Champlain Valley with temperature in the 80s and dewpoints in the 60s ahead of this boundary. The wind analysis from figure 4 below point to very little surface convergence along this boundary, while best combination of instability and shear was located over eastern NY into central-southern VT. In addition, a secondary cold front was approaching the St. Lawrence Valley on 12 July 2022 at 2 PM, per the analysis below. This did help to produce additional showers and storms, which stayed mainly below severe weather criteria.
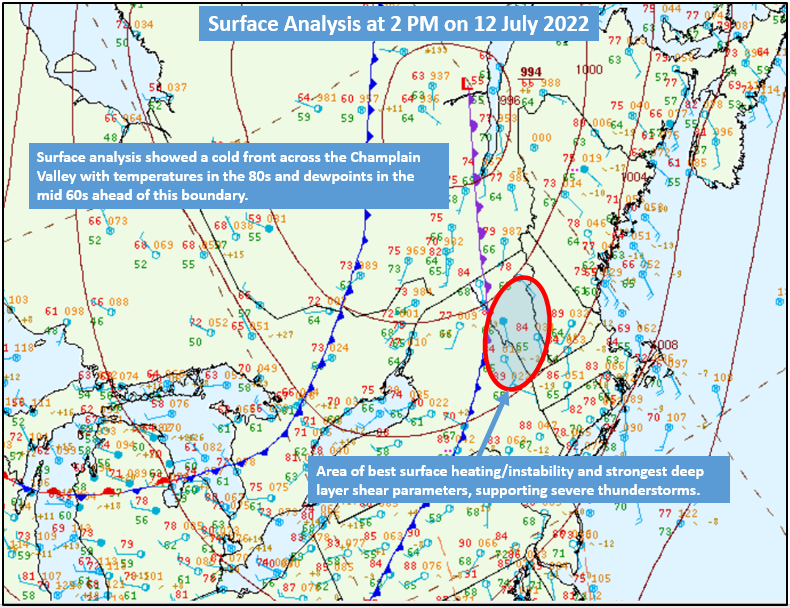
Figure 4: Surface analysis on 12 July 2022 at 2 PM.[click to enlarge]
The 500mb (20,000 feet above ground level) showed deep mid-level trough across the central Great Lakes, with a ribbon of enhanced winds greater than 60 knots lifting from the Ohio Valley into the northeast United States. The tightening of the black height contours in the image below, is typically a good indication of strong mid-level wind fields. This shortwave and mid-level wind speed maximum, helped to produce large-scale lift for thunderstorm development, while the strong winds aloft aided in favorable shear parameters for organized thunderstorms and damaging winds as the primary severe weather threat.
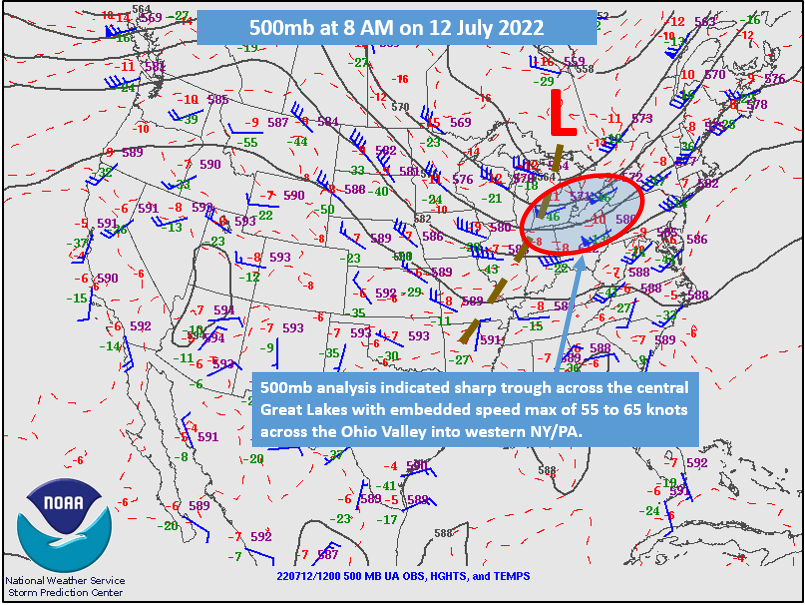
Figure 5: The 500mb (20,000 feet above ground level) upper air analysis on 12 July 2022 at 8 AM. Wind barbs, (plotted in blue, 1 arrow=50 knots, 1 barb=10 knots, 1/2 barb=5 knots), 500mb heights (black lines), and temperatures (dotted red).[click to enlarge]
Figure 6 shows Rapid Refresh (RAP) analysis of surface based CAPE (Convective Available Potential Energy), CIN (Convective Inhibition) and surface to 6 km shear from SPC on 12 June 2022 at 2 PM. As the mid-level jet approached the region the deep layer shear increased between 45 and 55 knots, while CAPE values ranged from 1500 to 2000 J/kg. The best combination of deep layer shear and instability (CAPE) was located across eastern New York into central-southern Vermont, and closely matches the region of greatest concentration of wind damage. This high shear/moderate CAPE pre-storm environment was conducive for organized and persistent convection to develop, capable of producing damaging winds associated with a bow echo storm structure.
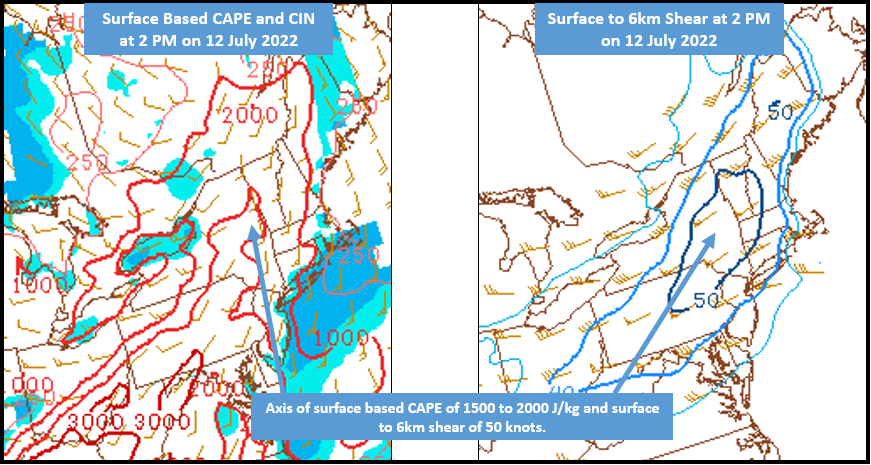
Figure 6: Storm Prediction Center (RAP) Rapid Refresh surface based Convective Available Potential Energy (CAPE) and Convective Inhibition (CIN) (left image) shade at 25 and 100 and surface to 6 km shear (right image) on 12 July 2022 at 2 PM.[click to enlarge]
The High Resolution Ensemble Forecast (HREF) highlighted nicely the enhanced wind speed maximum at both 500mb and 700mb associated with approaching mid/upper level trough. The HREF indicated 500mb wind maximum of 55 to 65 knots angling from northern Pennsylvania across eastern New York into central VT, with similar path of 700mb winds of 45 to 55 knots. This placed the best deep layer shear and greatest threat for organized convection with damaging winds from eastern New York into central-southern Vermont on 12 July 2022. Figure 7 below shows the HREF 500mb (left below image) and 700mb (right below image) wind fields and heights at 2 PM on 12 July 2022.
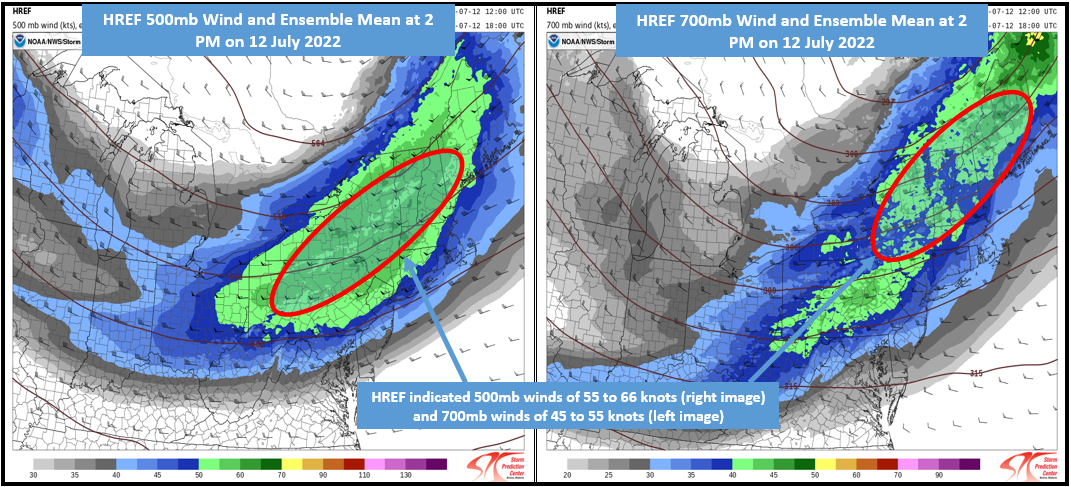
Figure 7: HREF 500mb wind (shaded blue 40 to 50 knots and green 50 to 70 knots) and ensemble mean heights (black lines) (left image) and 700mb wind (shaded blue 30 to 40 knots and green 40 to 50 knots) and ensemble mean heights (black lines) (right image) at 2 PM on 12 July 2022.[click to enlarge]
The NAM-3km instantaneous precipitation rate and mean sea level pressure product initialing at 8 AM on 12 July 2022 did an excellent job highlighting the location and timing of the most robust convection. Image 8 below shows the NAM-3km instantaneous precipitation rate loop from noon to 6 PM on 12 July 2022. This model guidance progged a developing line of thunderstorms across central-southern Vermont, with more scattered activity near the International Border. The deeper red, pink and purple colors in the loop, indicated where the model progged convection would be the strongest and provided forecasters an idea of location and potential threat, given the line segment reflectivity structure. This verified extremely well, as many reports of trees and power lines damage, along with some property damage occurred across central-southern Vermont during this event.
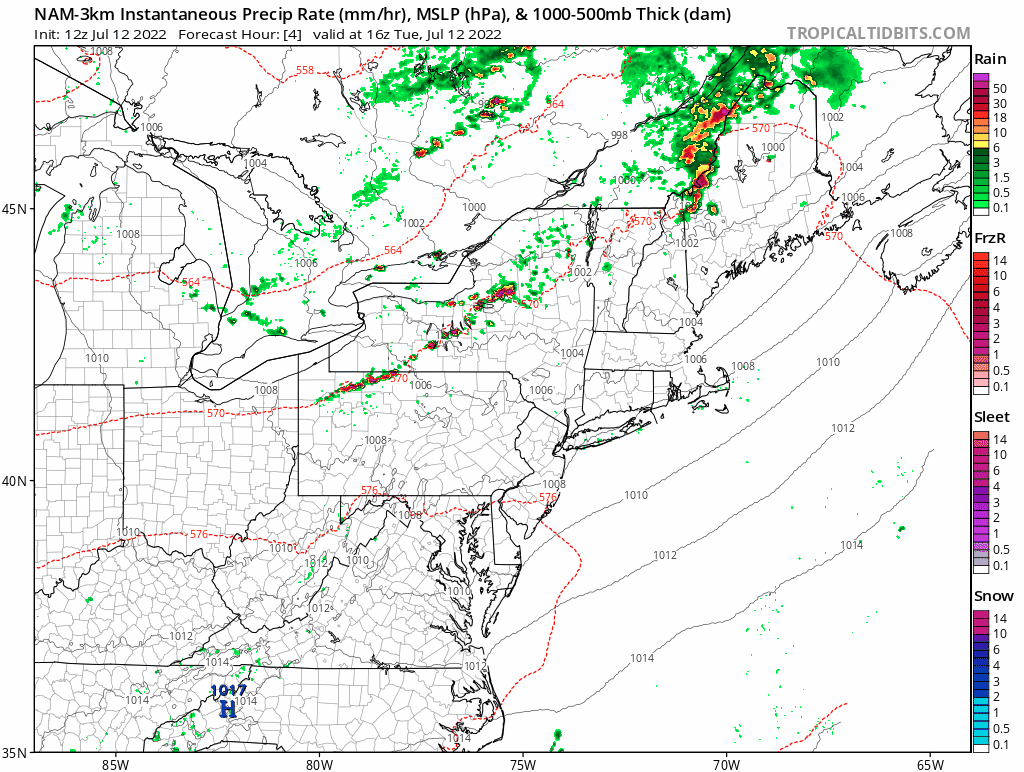
Figure 8: NAM-3km initialized at 8 AM on 12 July 2022 instantaneous precipitation rate (mm/hr), mean sea level pressure (MSLP) in hPa, and 1000 to 500mb thickness (dam) loop from Noon to 6 PM.[click to enlarge]
The GOES-16 Day Cloud Phase Distinction product did a good job of emphasizing the strongest updrafts with a bubbling/cauliflower appear to the cloud structure. In addition, you can see enhanced shadowing on the east side of the towering cumulus nimbus clouds, which extended up to 40,000 feet above the ground or around 8 miles high. These shadows are caused by the sun lowering in the western sky, as towering clouds block the light, casting a shadow on the east side of the cloud structure. Figure 9 below identifies several large towering cloud structures near the International border, with another very tall cloud formation over southern Windsor County, near Chester VT at 405 PM on 12 July 2022. During this event we were placed in the meso-sector with GOES-16 satellite imagery updating every 1 to 2 minutes, helping forecasters identify where thunderstorms were developing quickly and the vertical extent into the atmosphere, when utilizing different satellite products.
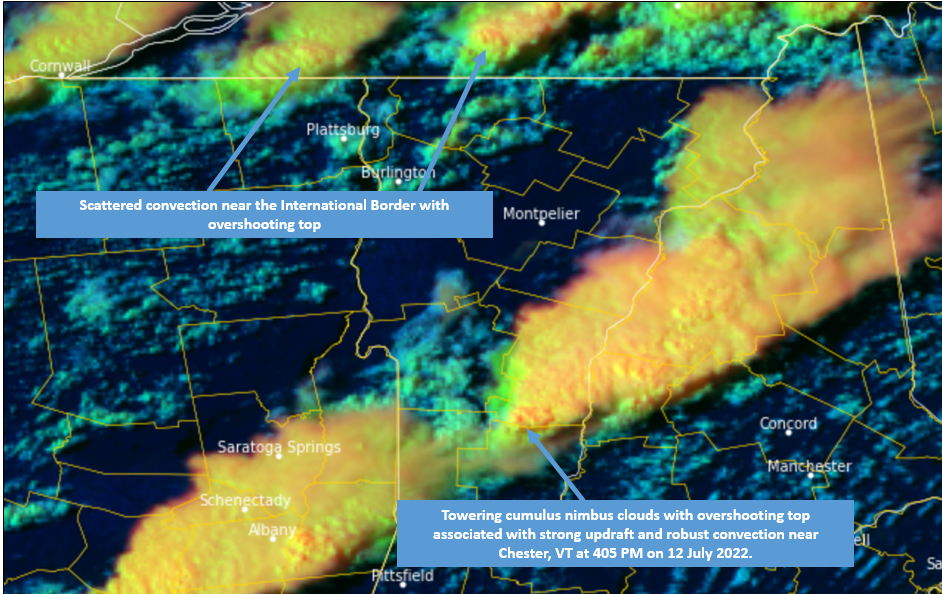
Figure 9: GOES-16 Day Cloud Phase Distinction at 405 PM on 12 July 2022.[click to enlarge]
Figure 10 below is the Multiple Sensor-Multiple Radar (MRMS) composite reflectivity loop from 2 PM to 5 PM on 12 July 2022, showing the evolution of thunderstorm activity across our region. The strongest and most concentrated storms were located across central-southern Vermont, while activity was scattered near the International Border. At 310 PM a discrete supercell type thunderstorm was observed near the Rutland/Bennington county lines, while a bowing line segment was across eastern Rutland county, quickly moving into western Windsor county. Given the strong flow aloft, these storms were moving 40 to 50 mph from west to east across the area, with strong damaging thunderstorms winds as the primary threat. The pink-purple color in the composite reflectivity loop below, suggests where the strongest storms were located and the greatest potential for severe weather, especially between 3:00 PM and 3:30 PM.

Figure 10: Multiple Radar Multiple Sensor (MRMS) composite reflectivity loop from 2 PM to 5 PM on 12 July 2022. [click to enlarge]
Figure 11: KCXX 1.3° reflectivity (left image), reflectivity cross section (center image), and echo top (right image) at 3:08 PM on 12 July 2022. The bowing line segment produced wind damage and power lines down along the Route 4 corridor from near Rutland to Mendon to Killington area, which resulted in several thousand customers without power. Radar reflectivity indicated a sharp forward flank reflectivity gradient, suggesting potential for severe winds, while several weak reflectivity channels associated with a descending rear inflow jet were evident. Velocity data was not shown in these examples because of poor low level sampling due to terrain blockage and the bowing line segment moving perpendicular to the radar beam.
The middle image below shows the KCXX reflectivity cross section at 3:08 PM of the bowing line segment , with a robust 50 dBZ core over 30,000 feet and 60 to 65 dBZ to 28,000 feet. The white line with an arrow to the middle image insert, indicates the approximate location of the reflectivity cross section was taken at 3:08 PM on July 12th. This cross section exhibited a weak forward flank overhang or Bound Weak Echo Region (BWER), signifying a strong updraft of moist/unstable air and potential for gusty outflow winds. At 3:08 PM the storm top echo reached almost 40,000 feet above ground level (AGL) with the bowing line near Route 4, while the supercell near the 4 county intersection had a storm top up to 44,000 feet AGL. These very tall storms and associated reflectivity structure, supported the threat for both severe winds and large hail across Rutland and Windsor counties.
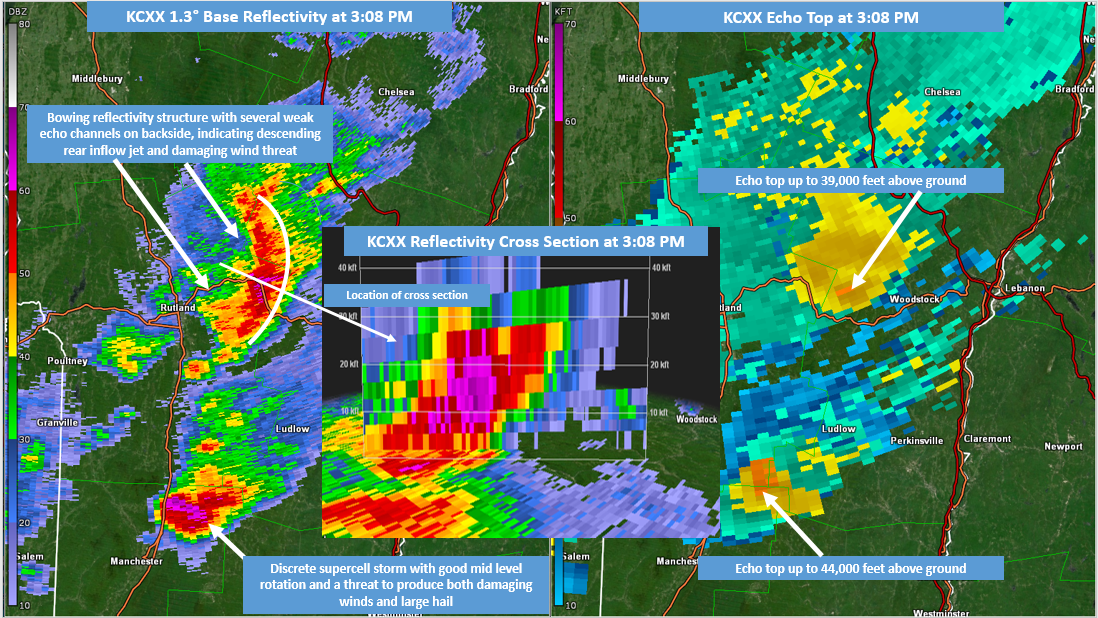
Figure 11: KCXX 1.3° reflectivity (left image), reflectivity cross section (center image), and echo top (right image) at 3:08 PM on 12 July 2022. [click to enlarge]
The radar image below (figure 12) shows KCXX reflectivity cross section at 3:08 PM on 12 July 2022 of a discrete supercell near the 4 county border area of Rutland/Windsor/Bennington and Windham counties in south-central Vermont. This individual storm had 50 dBZ to 30,000 feet and a solid 60 to 70 dBZ core extending up to 25,000 feet, indicating a very warm and unstable air mass was being lifted into the storm’s updraft. This very strong reflectivity structure indicated the potential for both large hail and damaging winds. This storm was 8 miles tall with storm top reflectivity over 40,000 feet AGL. The volumetric reflectivity cross section (lower right image) suggested a forward flank reflectivity overhang and BWER, suggesting very strong storm relative inflow and a storm capable of producing severe weather. Soundings showed a very unstable profile with tall equilibrium levels to 40,000 feet and favorable shear for organized and persistent convection capable of producing severe hail and damaging winds.
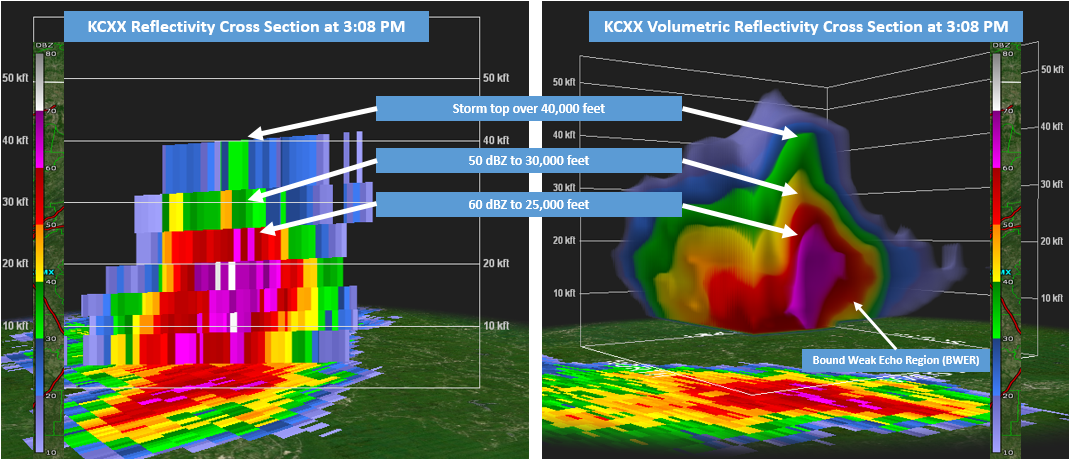
Figure 12: KCXX reflectivity cross section near 4 county intersection of Bennington, Rutland, Windsor, and Windham counties in southern Vermont at 3:08 PM on 12 July 2012. [click to enlarge]
A quick high-based thunderstorm near the International Border produced a gusty outflow boundary during the mid-afternoon hours on July 12th. The pre-storm environment across our northern areas featured steep surface to 700mb lapse rates >9.0 C°/km, DCAPE values near 1000 J/kg, and high cloud bases, supporting the potential for stronger mid-level winds to mix toward the surface. Figure 13 below shows the KCXX 1.3° base reflectivity (left image) and 0.5° base velocity (right image) at 4:20 PM on 12 July 2022. The radar trend indicated a decaying thunderstorm, moving nearly 50 mph tracked along the International Border and produced gusty outflow winds moving toward the radar of 40 to 45 knots (highlighted by white dash line on figure below). These sudden gusty winds produced isolated trees and power lines down across North Hero, Alburgh, and around Swanton, with most damage near the Lake Champlain shoreline or the Missisquoi River Basin.
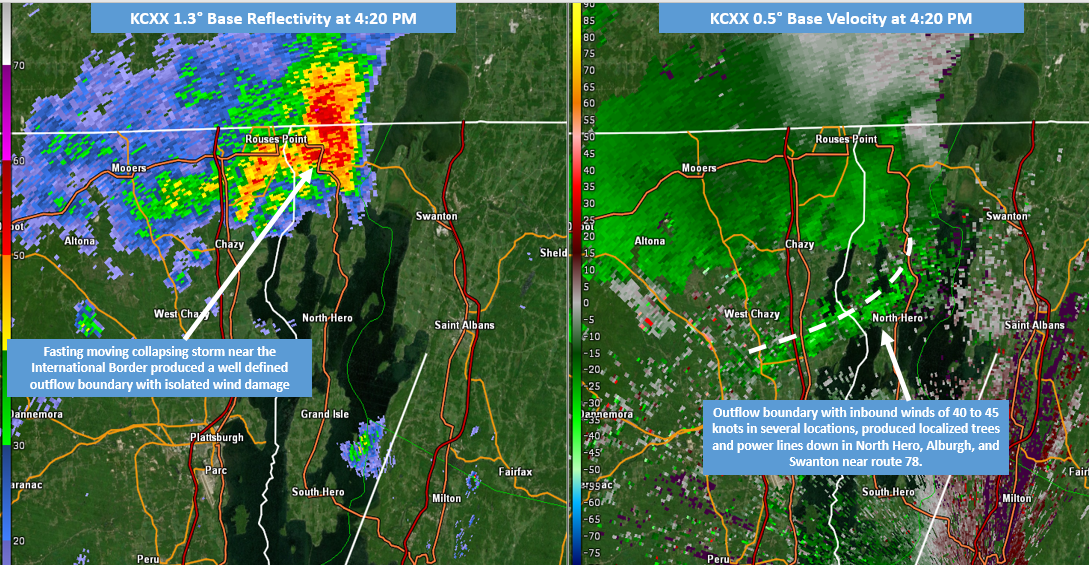
Figure 13: KCXX 1.3° base reflectivity (left image) and 0.5° base velocity at 4:20 PM on 12 July 2022. [click to enlarge]
A warm and moist air mass across the North Country on July 12th produced scattered wind damage, along with an axis of very heavy rainfall from eastern New York into parts of central-southern Vermont. The most concentrated area of damage occurred along and south of Route 4 in Rutland and Windsor counties, where a bowing line segment happened. Winds associated with this feature were estimated between 50 and 70 mph, based on damage pictures of trees and minor property damage. Other tree and power line damage was observed across the northern St. Lawrence and northern Champlain Valley during this event, with up to 10,000 people without power in Vermont. The image below highlights the North Country Storm Reports from July 12th.
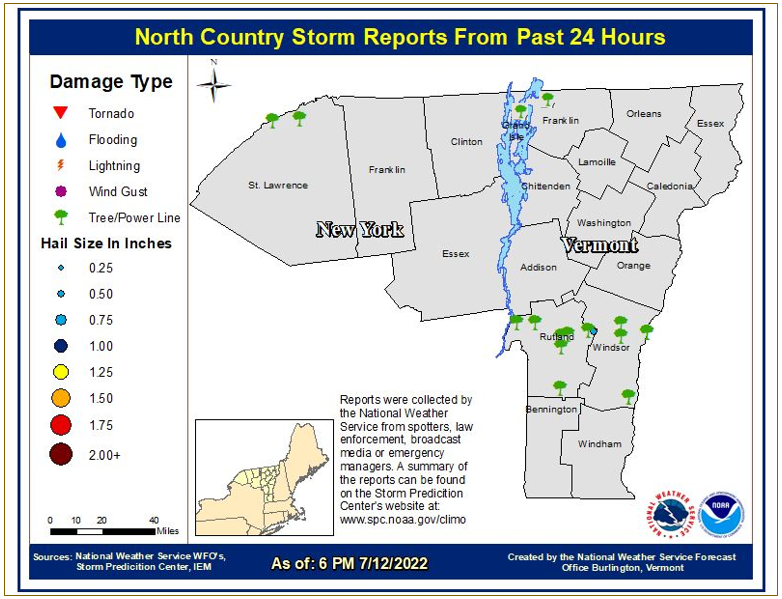
Figure 14: North Country Storm report as of 6 PM on 12 July 2022. [click to enlarge]
Disclaimer: Figure 8 courtesy of Tropical Tidbits web site: https://www.tropicaltidbits.com/
Radar imagery for images 11, 12, and 13 was generated using GR2Analyst, Gibson Ridge Software Company http://www.grlevelx.com/gr2analyst_2/

