
A Winter Storm Warning and Winter Weather Advisories are in effect through 8 PM Sunday for periods of snow, sleet and freezing rain. Snow and sleet accumulations of 2 to 9 inches are possible. Ice accumulations of one to four tenths of an inch are possible, with locally higher amounts possible. Isolated to scattered power outages are possible and travel may be hazardous at times. Read More >
 Email the authors
Introduction
On 30 July 2019 a cold front and associated pre-frontal trough interacted with a very warm and semi-humid air mass to produce scattered strong to severe thunderstorms. These thunderstorms packed a punch with a significant wind gust of 76 mph reported at the North Hero bridge project, while the Saranac Lake, New York Automated Surface Observing Station (ASOS) measured a 60 mph thunderstorm wind gust. The highest concentration of trees and power lines down occurred in northern New York into parts of the central/northern Champlain Valley. Temperatures in the mid 80s to lower 90s with dewpoint values well into the 60s, produced a pre-storm environment very favorable for thunderstorm development. These very warm temperatures created surface based CAPE values in the 1000 to 2000 J/kg range, while better deeper layer shear (stronger winds in the mid levels) was approaching the region associated with development of mid/upper level trough. An early morning ribbon of clouds helped to stabilize the Saint Lawrence Valley, while placing most of the focus for thunderstorm development from the Adirondack Mountains into northern/central Vermont. Please see figure 18 for a hand drawn analysis by a forecaster here at WFO BTV, highlighting the necessary ingredients (instability, shear, moisture, lift) for thunderstorm development.
In this event summary will we examine the pre-storm environment and associated ingredients which came together to produce severe storms, along with a detailed interrogation of the most powerful/damaging storms. Figure 1 below highlight locations that saw thunderstorm damage during this event across the North Country. Click here for a listing of local storm reports received by the National Weather Service Office in Burlington, Vermont.
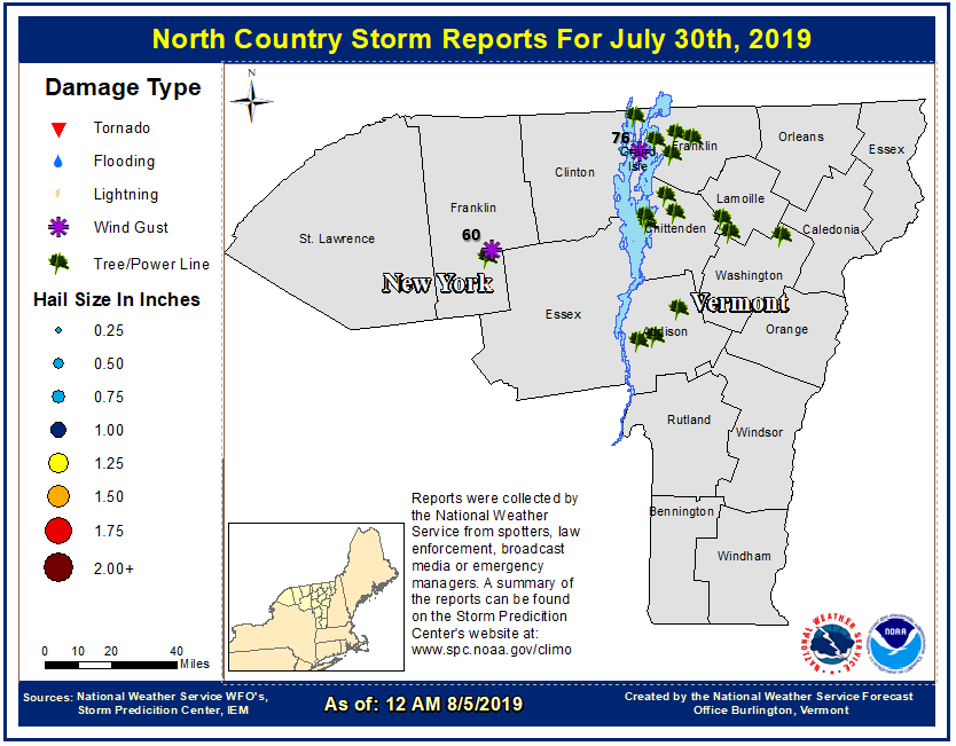
Figure 1: North Country local storm reports on 30 July 2019.[click to enlarge]
Pre-Storm Environment
From the image below you can see the Storm Prediction Center (SPC) placed most of northern New York and parts of northwest Vermont, including the Champlain Valley into a slight risk of severe thunderstorms with their day 1 outlook issued at 1630 UTC on 30 July 2019. Click here for the day 1 outlook discussion. The slight risk implies well-organized severe thunderstorms are expected, but in small numbers and/or low coverage. Depending on the side of the area, approximately 5 to 25 reports of 1 inch or larger hail, and/or 5 to 25 wind events, and/or 1 to 5 tornadoes are possible in slight risk. The probabilistic wind from SPC (lower right) showed at 15% chance of severe thunderstorm winds within 25 miles of a given point across central/northern NY into parts of northwest Vermont.

Figure 2: The Storm Prediction Center (SPC) Day 1 categorical outlook (left), and SPC Wind Outlook (right) issued at 12:30 PM on 30 July 2019.[click to enlarge]
In this section we will investigate the pre-storm environment from upper air analysis to reviewing conditions favorable for promoting severe thunderstorm wind gusts. Figure 3 below shows the 300 hPa (lower left) (35,000 feet above ground level) and 500 hPa (lower right) (20,000 feet above ground level) upper air analysis on 31 July 2019 at 00 UTC. The upper environment featured an approaching trough with associated 75 knot jet maximum lifting north of Lake Ontario. The combination of the right rear quadrant of this jet streak, along with approaching mid/upper level trough enhanced the large scale synoptic lift across northern New York into Vermont. Furthermore, a modest 500 hPa jet of 35 to 40 knots approached northern New York during the mid afternoon hours on July 30th to increase the deep layer shear parameters favorable for semi-organized convection.

Figure 3: The 300 hPa (left) and 500 hPa (right) upper air analysis on 30 July 2019 at 8:00 PM., Isotach (dark blue >75 knots, lighter blue >100 knots, and lightest blue >125 knots, streamlines (black), wind barbs, (plotted in blue, 1 pennant=50 knots, 1 barb=10 knots, 1/2 barb=5 knots), 500 hPa heights (black lines), and temperatures (dotted red).[click to enlarge]
The image below shows the 00 UTC Albany, New York on 31 July 2019. This sounding highlighted favorable low level mixing profiles with surface to 3km (~700 hPa) lapse rates near 8.0°C/km and downdraft CAPE (DCAPE) of 1330 J/kg, with moderate surface based CAPE values of 1600 J/kg and Lifted Index of -5°C were observed. These lapse rates were super-adiabatic across the Champlain Valley where observed temperatures were in the low to mid 90s, while dewpoints dropped into the 60s. This dry and hot low level environment produced high cloud bases near 6000 feet and this allowed for favorable mixing of winds aloft toward the surface during the stronger convective downdrafts. The surface to 6km shear was only 20 knots, as the core of strongest 850 to 500 hPa winds were located across Ontario, Canada into parts of northern New York. The high freezing levels of 14,000 feet would limit the severe hail threat, while equilibrium levels near 40,000 feet helped with vertical development of thunderstorms with potential echo tops nearly 8 miles high. Furthermore, the deep dry layer in the observed sounding limited the areal coverage of convection, while helping to enhance updraft strength through dry air entrainment.

Figure 4: Upper air sounding from Albany, NY at 8:00 PM on 31 July 2019.[click to enlarge]
The 1800 UTC surface map (figure 5 below) on 30 July 2019 features low pressure northwest of Montreal, with a surface cold front extended into the Saint Lawrence Valley, while a lee side trough/lake breeze boundary was present on the eastern side of the Adirondack Mountains. These boundaries helped to focus low level convergence and provide lifting mechanism for scattered to numerous thunderstorm development. Temperatures in the Champlain Valley were well into the 90s with Highgate, Vermont at 94 degrees, while Burlington was 93 degrees, with dewpoints in the mid to upper 60s. These very warm and semi humid conditions provided the fuel needed for severe thunderstorm during the late afternoon hours on 30 July 2019.
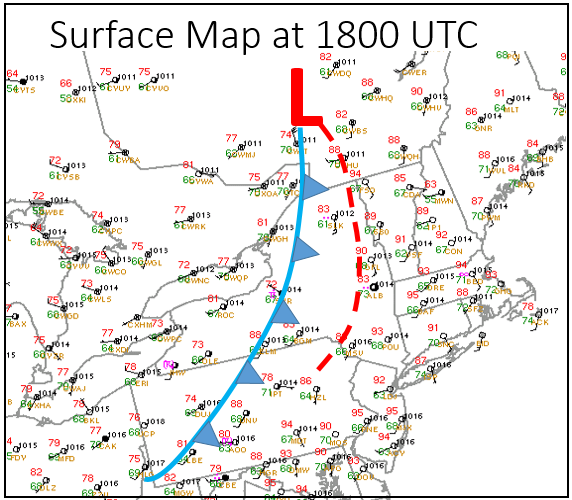
Figure 5: Surface map analysis with surface plots, cold front (blue line with triangles), warm front (red half circles), and trough (red dotted line) at 2:00 PM on 30 July 2019.[click to enlarge]
Figure 6 below shows the most unstable CAPE profiles and effective bulk shear at 1900 on 30 July 2019 from SPC. This highlights an axis of of 2000 to 2500 J/kg of CAPE across northern New York into parts of central and northern Vermont, while the best bulk shear of 25 to 30 knots was lagging the area of most unstable air. When both instability and shear coexist, the environment is favorable for organized convection to develop and the chances for severe thunderstorms increase.

Figure 6: Storm Prediction Center Rapid Refresh (RAP) mesoanalysis of Most Unstable CAPE (red lines), Convective Inhibition (CIN) (light blue fill), and effective bulk shear > 25 knots (orange wind barbs) at 3:00 PM on 30 July 2019.[click to enlarge]
An interesting pre-storm environment parameter was the very high Downward Convective Potential Energy (DCAPE) values from the eastern Adirondacks into most of Vermont, highlighting the possibility of damaging downburst winds. Figure 8 below shows the DCAPE at 1800 UTC, note the axis of 1000 to 1100 J/kg across the Champlain Valley, where the greatest concentration of wind damage occurred during this event. DCAPE values greater than 1000 J/kg suggest steep low level lapse rates which are conducive to downward transport of higher momentum air to the surface, resulting in possible severe thunderstorm wind damage. The higher the DCAPE value the stronger the rain-cooled downdraft potential within a thunderstorm. The RAP 0 to 3 km lapse rate analysis (figure 8 below) showed values between 8.0 to 9.0°C/km, which is very steep, indicating low level instability is present and thunderstorm development with gusty winds are possible if moisture and lift are sufficient. Figure 8 below shows the RAP 0 to 3 km lapse rate analysis at 1800 UTC on 30 July 2019.

Figure 7: Storm Prediction Center Rapid Refresh (RAP) mesoanalysis of Downward Convective Available Potential Energy (DCAPE) at 1800 UTC on 30 July 2019.[click to enlarge]

Figure 8: Storm Prediction Center Rapid Refresh (RAP) mesoanalysis of 0 to 3 km lapse rates at 1800 UTC on 30 July 2019.[click to enlarge]
Figure 9 below shows the mesoscale outline (lower left) and severe thunderstorm watch box #545 (lower right) issued by SPC. Click here for the mesoscale discussion. The mesoscale discussion was issued around noon, while the severe thunderstorm watch was issued shortly after 17 UTC on the 30th of July. This provided plenty of time for NWS BTV to message the potential for thunderstorm development and the associated impacts.

Figure 9: The Storm Prediction Center Mesoscale Outline (#1613) and Severe Thunderstorm Watch Box (#545).[click to enlarge]
Figure 10 below shows channel 2 - 0.64 μm visible band (left) and channel 13 - 10.3 clean IR long wave imagery (right) on 30 July 2019 at 1946 UTC. The black arrows indicate the location of multiple storm tops. These storm top locations are very close to the location of 60 mph wind gust at Saranac Lake ASOS and damaging winds across the northern Champlain Valley. This type of storm top is called an overshooting top which is a dome-like protrusion above a thunderstorm anvil cloud and represents a very strong updraft and a higher potential for severe weather. A persistent and/or large overshooting top (anvil dome) often is present on a supercell. A short-lived overshooting top, or one that forms and dissipates in cycles, may indicate the presence of a pulse storm. In this case, we had a storm with an up and down cycle or a pulse storm.

Figure 10: GOES-16 channel 2 - .64 μm visible imagery (left image) and GOES-16 channel 13 - 10.3μm clean IR long wave imagery (right image) on 30 July 2019 at 1946 UTC.[click to enlarge]
Radar Analysis
The following composite radar reflectivity in figure 11 below shows the coverage and intensity of thunderstorms quickly evolving during the early afternoon hours of July 30th. The darker red and orange colors indicate areas of strong to severe thunderstorms with gusty winds, very heavy rainfall, and frequent lightning. As the storms moved into a more unstable environment with slightly better deep layer shear, several embedded bowing line segments developed. These were observed over the northern Champlain Valley and across central Addison County in Vermont. The highest concentration of wind damage was witnessed near the apex of these miniature bowing segments.

Figure 11: Composite radar reflectivity from 1500 UTC to 2100 UTC on 30 July 2019.[click to enlarge]
Saranac Lake, New York Observed 60 MPH Wind Gust
The first storms to produce tree damage and severe wind gusts for the event took place across Northern New York. At 1925 UTC, tree damage was reported at Lake Clear, and then 3 minutes later, a 60 mph gust was reported at Saranac Lake Airport. Portions of the interior Adirondacks can be difficult to assess. The lowest scans of KTYX were sampling at 7500 feet, making it difficult to assess what was happening near the surface. Though KCXX samples at 4000 feet, partial beam blockage from the mountains make the signals more challenging to interpret.
Utilizing a cross section though, the collapse of the storm that caused the wind gust and tree damage can be seen in the base reflectivity and Specific Differential Phase (KDP).
Damage in north Burlington/Colchester areas
At 1524 UTC, a thunderstorm was detected near Willisboro Point in New York with inbound radar velocities of over 50 knots. Due to the motion towards the radar, sampling of the wind speeds within the storm could be easily assessed. As the storm developed over Lake Champlain, radar detected velocities of 65 knots, as seen in Figure 13, were located just 200 feet off the surface. These winds came ashore near 1542 UTC causing widespread damage to trees and powerlines across Burlington and Colchester. These wind gusts continued northeastward toward Milton where additional wind damage was observed. Eventually, this storm interacted with another cluster of storms moving across the Grand Isles and Franklin County.

Figure 13: An animation of the KCXX 0.5 degree scan velocity (left) and reflectivity (right) from 1524 UTC to 1559 UTC, as a strong storm produced wind damage across the New North End in Burlington into Colchester and eventually into Milton. Note the 60-65 knot winds measured by the radar just a few hundred feet off the ground. [click to enlarge]
North Hero, Vermont 76 mph Gust
While damaging winds were lifting into the Burlington and Colchester areas, a cluster of storms developed across Grand Isle County and produced several reports of strong, damaging winds across Grand Isle and Franklin County. This included a 76 mph gust at North Hero bridge project. Due to the eastward motion of the storm, which is perpendicular to the radar beams sent out by the KCXX radar, velocities were underestimated making the evaluation of severe winds challenging. However, other techniques were applied when analyzing this storm. As demonstrated before, examining the collapse of a storm’s core can be used to assess the cause of strong winds (Figure 14). Another method can be through assessing the storm top divergence. Radar detected inbounds and outbounds adding above 70 knots, which typically indicates the storm is likely to produce damaging winds as well as potentially severe hail, along the top of the thunderstorm (Figure 15). As the cluster of storms moved into Franklin County, storm top divergence of around 75 knots was measured with the hail algorithm indicating the potential for one inch hail.

Figure 14: Animated cross section taken from GR2 Analyst of base reflectivity (Z) (left) and Specific Differential Phase (KDP) (right) using KCXX samples between 1947 UTC and 2017 UTC. Cross section is oriented southwest to northeast with Plattsburgh positioned to the left and Saint Albans positioned on the right. Note the recycling KDP cores and pulses of strong updrafts within the storm. Wind damage coincides with the KDP cores falling and the storm collapsing.[click to enlarge]
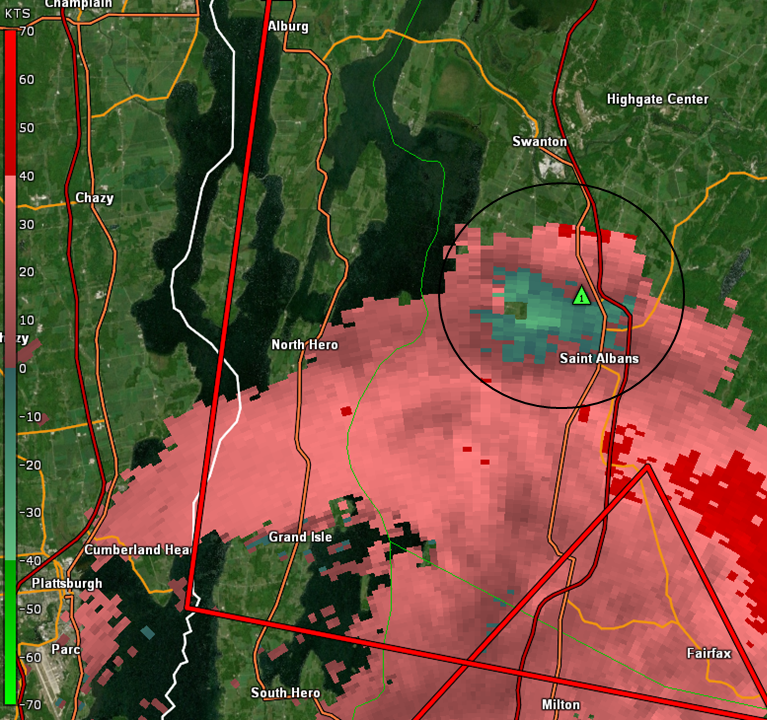
Figure 15: Storm Relative Velocity measured at the top of the storm in North Hero as it moved towards St. Albans with a black circle to outline the region of interest. Storm top divergence of about 75 knots was detected, with the hail algorithms indicating the potential for 1 inch hail noted with the green triangle.[click to enlarge]
Strong straight-line winds can also loft debris upwards, which can be detected in correlation coefficients products. Correlation coefficients (CC) are highest when a radar beam samples a collection of returns with similar shape and uniform distribution. When the radar beam detects irregular shapes like blowing debris, values tend to fall. As the gust front that impacted Chittenden County lifted northwards, some of the debris was detected on radar. Downburst winds were strong enough to loft debris above 1000 feet as seen in Correlation Coefficient outputs (Figure 16).

Figure 16: Map of Correlation Coefficient (CC) which display lower values displayed in blue. Lower values are marked in blue and indicate the presence of debris. The black circle marks the area of debris lifting north near Sheldon.[click to enlarge]
Central Addison County Storms
Addison County was impacted by two different storms that went through at approximately 1945 UTC that impacted Bridport and then around 2130 UTC that impacted Middlebury. Similar to the cluster of storms that traveled east across the Grand Isle, these eastward moving storms were challenging to assess due to underestimated radar velocities, as the storms moved perpendicular to the radar beam. The storm collapse on the first storm was difficult to capture from radar, but the second storm that impacted Middlebury displayed another classic signature of a core collapse which can be seen in Figure 17. The combination of good low level mixing of wind fields and storm motions of 35 to 40 mph, increasing the damaging wind potential with any collapsing thunderstorms across central Addison County.
Summary with Storm Photos
The approaching mid/upper level trough helped to enhance stronger mid/upper level wind fields on the 30th, which produced slightly better deep layer shear for organized convection to develop. In addition to slightly better shear profiles, the amount of instability or CAPE was in the 1000 to 2000 J/kg range, with very steep 1000 to 700mb lapse rates, producing an environment favorable for strong to severe thunderstorms. The steep lapse rates created large downdraft CAPE (DCAPE) values up to 1000 J/kg, which supported the idea of severe thunderstorms capable of damaging winds. The hand drawn severe weather composite analysis below highlights the lift, moisture, instability and shear profiles on July 30th across our forecast area. The better instability and shear parameters, interacting with favorable lift and moisture profiles created an environment for scattered strong to severe thunderstorms across parts of northern New York into Vermont. These storms produced a 76 mph wind gust in North Hero, an observed 60 mph gust at the Saranac Lake ASOS in northern New York, and several areas of trees and powerlines down in Franklin, Addison, and Chittenden Counties in Vermont. Figures 19 through 21 show wind damage associated with a severe thunderstorm over the North End of Burlington, Vermont. The severe thunderstorm winds and frequent lighting caused several thousand people to lose power across the region during the afternoon and evening hours on July 30th. Some relief to the heat and humidity arrived behind the surface cold front to start the month of August.
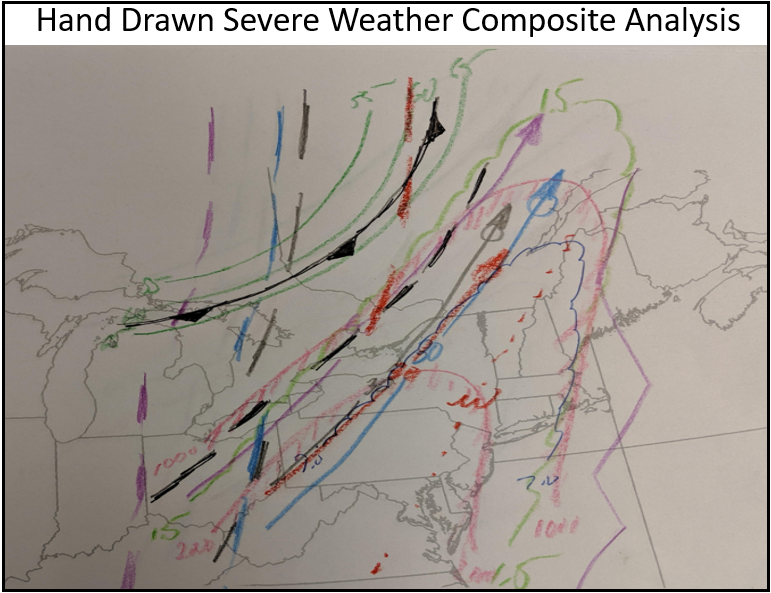
Figure 18: Hand drawn severe weather composite analysis, highlighting lift, moisture, instability, and shear.[click to enlarge]

Figure 19: Trees downed in North End of Burlington. Photo courtesy of NWS Employees Matthew Clay and Rebecca Duell.[click to enlarge]

Figure 20: Trees downed in North End of Burlington. Photo courtesy of NWS Employees Matthew Clay and Rebecca Duell.[click to enlarge]

Figure 21: Trees downed in North End of Burlington. Photo courtesy of NWS Employees Matthew Clay and Rebecca Duell.[click to enlarge]
Reference


