
A storm and trailing cold front will continue to slowly move through the Gulf Coast and Southeast U.S. through this weekend with widespread rain showers and isolated thunderstorms. A fast-moving clipper storm may bring several inches of snow to the north-central Plains, Midwest, eastern Great Lakes, and Northeast regions this weekend. Read More >
 Email the authors
Overview
On Friday, 26 March 2021, an EF-1 tornado struck the northeast side of Middlebury, Vermont, causing two injuries along with property and tree damage in the vicinity of Painter Road. A damage survey conducted by NWS Burlington determined that the tornado was on the ground for approximately 1 minute (around 1:40 pm EDT). The damage path covered approximately 0.6 miles with a maximum path width of 75 yards. Four homes suffered damage.
Other isolated severe storms across the region on 26 March 2021 caused wind damage early that afternoon. The first wind damage report was received near Parrisville, NY at 12:02pm EDT. Reports of wind damage in Essex County New York occurred between 12:14-12:20pm EDT in Schroon Lake and Crown Point. Storms moved eastward from there with wind damage reported across both Addison and Washington counties in Vermont, including in Montpelier around 2:30pm EDT. A total of 13 wind damage reports were received that afternoon, in addition to the tornado.
The Middlebury tornado was an exceptionally rare early season event. The only other documented March tornado in Vermont was an F2 in Shaftsbury on 22 March 1955. However, a review of synoptic weather data and Bennington County newspaper clippings suggest that the widespread damage on 22 March 1955 was likely caused by a downslope windstorm, common to the western slopes of the Green Mountains in association with strong synoptic low pressure systems (Fig. 1). Surface temperatures that day hovered in the 30’os F. The damage on 22 March 1955 was apparently mischaracterized as a tornado in the National Severe Weather Database. As such, we are confident that the Middlebury tornado is the earliest occurrence of a tornado in Vermont in a given calendar year, dating back through at least 1950.
The remainder of this paper is organized as follows. In Section 2, we’ll review Storm Prediction Center products leading up to the event. In Section 3, we’ll examine the synoptic and mesoscale setting. In Section 4, a radar analysis is performed. Lastly, damage survey information is conveyed in Section 5.

Figure 1. Surface analysis from the Daily Weather Maps series valid at 7AM EST on 22 March 1955 (left). A portion of a front-page newspaper article describing the storm in the Bennington Evening Banner on 23 March 1955 (right).[click to enlarge]
Storm Prediction Center Convective Forecasts and Watches
The Day 1 Convective Outlook issued by the Storm Prediction Center (SPC) leading up the event indicated the entire North Country was in marginal risk for severe thunderstorms (Figure 2). The SPC marginal risk implies, "an area of severe storms of either limited organization and longevity, or very low coverage and marginal intensity". All of northern New York and Vermont was included in a 2% tornado probability. This meant that there was a 2% to <5% probability of tornadoes occurring with 25 miles of any point within that probability area. Meanwhile, the probabilistic wind forecast from SPC, showed a 5% chance of severe thunderstorm winds (≥ 58 mph) within 25 miles of a given point during the outlook period across northern New York into all of Vermont. Click here to review the entire 1 Day Convective Outlook from SPC.
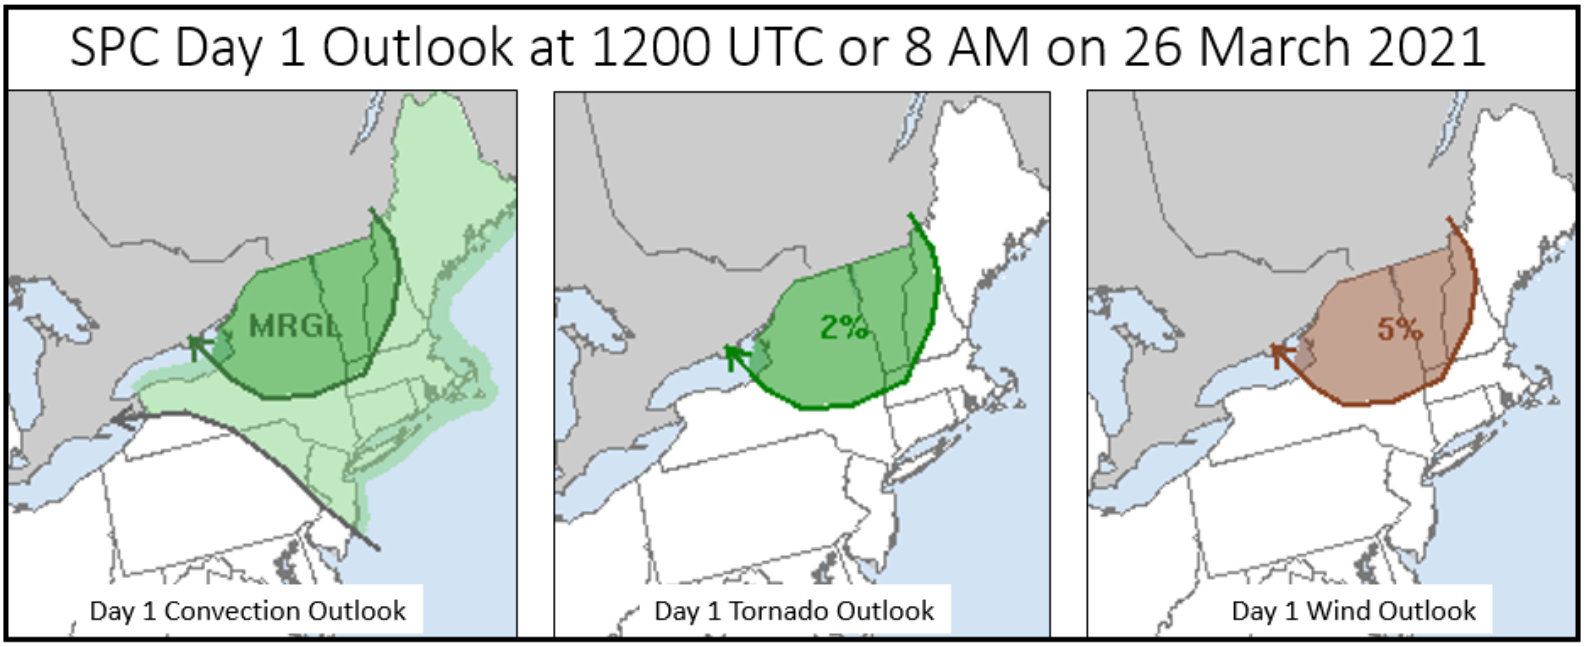
Figure 2. Storm Prediction Center (SPC) Day 1 categorical outlook (left), Tornado Probability Outlook (middle), and Wind Probability Outlook (right).[click to enlarge]
At 1013 AM EDT SPC issued Mesoscale Discussion #0271 highlighting the severe weather potential and suggesting a watch might be possible across northern New York into portions of central and southern VT. This discussion stated scattered storms were expected to develop by midday and a few could produce localized wind damage and a brief tornado was also possible. Furthermore, the discussion indicated partial clearing was developing ahead of a cold front and this was allowing the atmosphere to destabilize, with sufficient surface-based CAPE (SBCAPE) and favorable deep layer shear present for severe thunderstorms.
At 1110 AM EDT SPC issued Severe Thunderstorm Watch #57 covering all of northern NY into most of VT until 4 PM EDT, highlighting conditions favorable for severe thunderstorm development. A second Mesoscale Discussion #0272 was issued at 12:33 PM EDT stating severe weather threat continues for Severe Thunderstorm Watch #57, with a few severe wind gusts possible over the next couple hours. Radar was indicating an arcing line of storms with periodic Quasi Linear Convective System (QLCS) structures was moving rapidly toward the Champlain Valley, while a narrow axis of instability remained ahead of this line. Figure 3 shows the two Mesoscale Discussion graphics issued by the SPC on 26 March 2021. We’ll cover the mesoscale and radar analysis in more detail in the following two sections.

Figure 3. Storm Prediction Center Mesoscale Discussion #0271 and #0272 graphics on 26 March 2021.[click to enlarge]
Synoptic and Mesoscale Environment
We’ve utilized the SPC mesoanalysis (which utilizes a 1-hr RAP forecast as the first guess field) to describe the synoptic and mesoscale environment leading to the severe convection on 26 March 2021. The main feature of note was a vigorous mid-level shortwave trough, which tracked northeastward across the eastern Great Lakes region and along the St. Lawrence River during the morning and early afternoon hours on 26 March 2021 (Fig. 4). The shortwave trough was associated with strong low-mid level wind fields, including an 80-90kt southwesterly mid-level jet at 500mb approaching soutwestern Vermont at 26/16Z (noon EDT). Divergence in the left-exit region of this jet likely contributed to forcing for ascent across central and northern New York into western Vermont during the late morning and early afternoon hours (Fig. 4a). At 700mb, a closed low was present across Lake Ontario at 26/16Z, with 50-65kt southwesterly winds entering western and southwestern Vermont (Fig. 4b). A well-defined moisture axis was present across eastern New York and western New England on the 925mb and 850mb analyses (Fig. 4c and 4d), with veering winds with height noted through the low-mid troposphere.
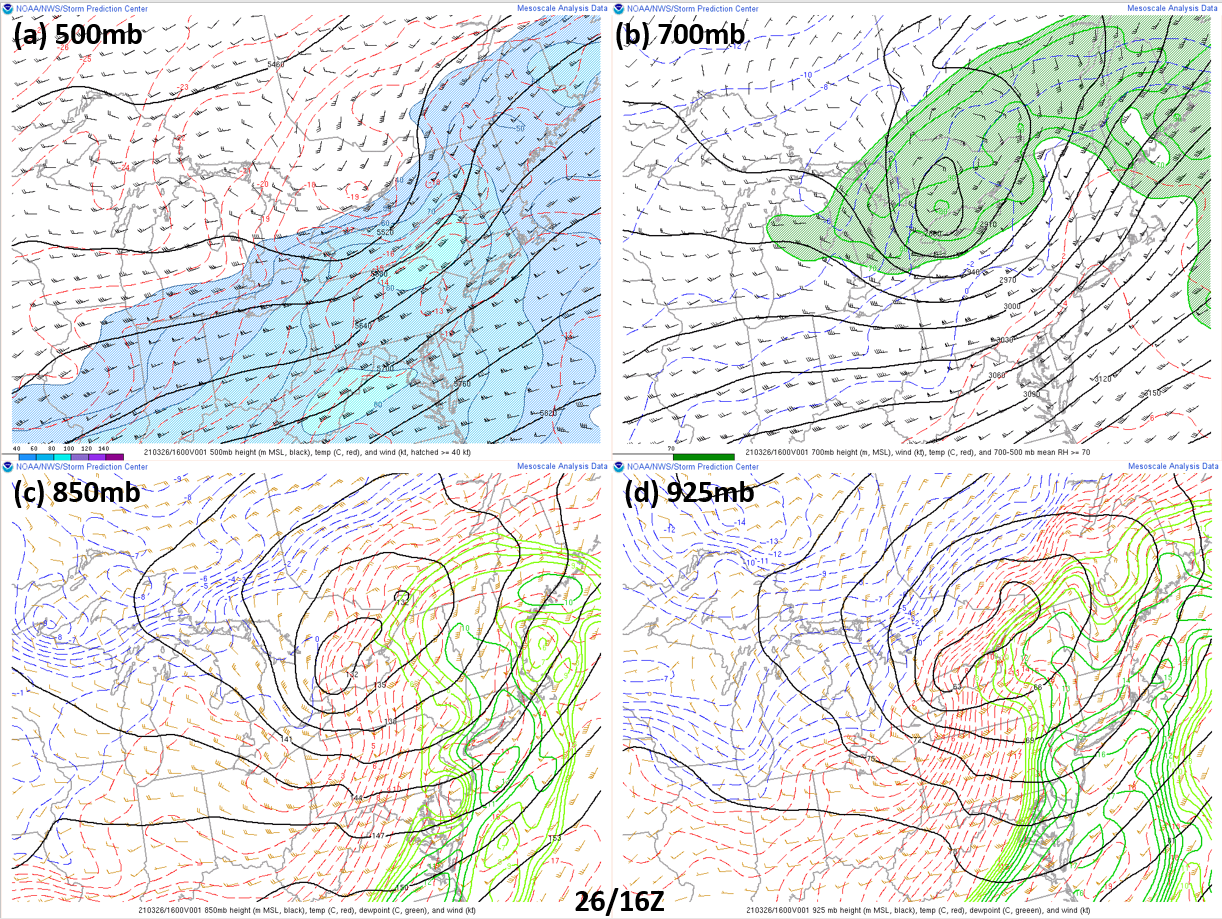
Figure 4. SPC mesoanalysis data valid at 16Z (noon EDT) on 26 March 2021 for (a) 500mb, (b) 700mb, (c) 850mb, and (d) 925mb. Solid lines represent geopotential height (decameters), dashed lines represent temperature (deg C), and wind is displayed in knots. Isotachs above 50kt are shaded at 500mb. Relative humidity >70% is shaded at 700mb. Dewpoints (deg C) are indicated by the green solid lines at 850mb and 925mb.[click to enlarge]
The veering winds with height were also evident on the observed 26/12Z sounding from Albany, New York, along with a remnant elevated mixed layer (EML) with near dry adiabatic lapse rates from 850-675mb (Fig. 5). Boundary layer dewpoints near 60deg;F were advected northward across eastern New York into western and central Vermont by a strong southerly wind component at low-levels. The combination of boundary layer dewpoints near 60°F and steep mid-level lapse rates maximized available surface-based instability. As clearing and insolational heating developed during the midday hours, low-level lapse rates steepened into southwestern VT and SBCAPE values increased 400-500 Jkg-1 over a 3-hr period (Fig. 6). That said, SBCAPE likely did not exceed 1000 Jkg-1 for this event; the tornado occurred in a low-CAPE, high shear environment.

Figure 5. Observed rawinsonde data and analysis from Albany, New York (ALB) valid at 12Z on 26 March 2021.[click to enlarge]

Figure 6. (a) The 3-hour change in SBCAPE (positive (negative) change in red (blue), J kg-1) and sea-level pressure (mb, black lines), and (b) the surface-3km AGL mean lapse rate (C km-1) valid at 26/17Z (1 PM EDT on 26 March 2021). [click to enlarge]
At the surface, a warm front extended from low pressure near the International Border in northern New York into northern Vermont, before dropping south across central Vermont into southern New Hampshire on 26 March 2021 at 1 PM EDT (Fig. 7). A sharp cold front was quickly moving across the Adirondack and approaching the Champlain Valley at this time. Temperatures in the warm sector were well into the 60s with surface dewpoints in the upper 50s to near 60deg;F across the Champlain Valley, creating enough instability to promote severe thunderstorm development ahead of the cold front. The meteogram for the Middlebury airport (K6B0, Fig. 8) shows temperatures quickly rose to 67deg;F with max dewpoints around 60deg;F in the warm sector and where a dry slot was developing on satellite imagery (Fig. 9). Winds generally backed to southeasterly in advance of the tornado time (Fig. 8, denoted by the blue line), and southeasterly wind gusts to 22 knots at 1735Z (1:35 PM EDT) were likely a reflection of the inflow to the tornadic cell as the storm passed several miles north of the airport. Drier air followed the convective storms, with a northwesterly wind shift late in the afternoon.

Figure 7. Surface map at 17Z (1 PM EDT) on 26 March 2021 with standard station model plots shown. The temperature at Middlebury (K6B0) had reached 67deg;F, the high for the day.[click to enlarge]

Figure 8. Meteogram for Middlebury, Vermont airport (K6B0) from 1055Z through 2155Z (6:55am through 5:55pm EDT). The 2-meter temperature (deg;F, red), 2-meter dewpoint (deg;F, green), 10-meter wind speed (knots, blue) are valid in 15-minute intervals. Wind direction (knots, gold) and wind gusts (knots, open circles) are shown when available. The vertical light blue line represents the time of the tornado at 1740Z (1:40pm EDT).[click to enlarge]
Partial clearing and surface heating within the synoptic dryslot allowed for boundary layer destabilization during the late morning and early afternoon leading up to the tornado. The visible satellite imagery at 12:33 PM EDT (Fig. 9, left) shows an axis of clearing skies across the Champlain Valley ahead of the approaching cold front. This clearing was critical in destabilizing the boundary layer prior to the cold front, for the development of severe thunderstorms capable of producing tornadoes because of the strong near-surface and deep-layer shear present. The infrared satellite image (Fig. 9) shows the colder/higher cloud development, indicating deeper convection near Middlebury, VT at 1739Z (1:39 PM EDT).

Figure 9. GOES-16 satellite visible "Blue" 1633Z (12:33 PM EDT, left image), Visible "Blue" at 1739Z (1:39 PM EDT, middle image), and Infrared "Clean" at 1739Z (1:39 PM EDT, right image) on 26 March 2021. The tornadic storm is indicated by the red oval in the middle and right panels.[click to enlarge]
With sufficient moisture and a narrow surface-based instability axis present, the mesoscale environment was briefly favorable for tornadoes across western Vermont. The surface-6km bulk shear was extreme, ranging from 60-80 kt across central and southern Vermont (Fig. 10a); typically 35kt is sufficient for rotating updrafts and supercells. Likewise, strong sfc-1km bulk shear (not shown) of 30-35 kt and a strong veering wind profile contributed to surface-1km storm-relative helicity values ~200 m2s-2 (Fig. 10b) which is considered favorable for low-level mesocyclones and tornadoes. Consistent with this, popular composite severe weather parameters, including the Supercell Composite Parameter (Fig. 10c) and Significant Tornado Parameter (Fig. 10d), were showing favorable values in a boundary layer environment absent convective inhibition. The question at this point would be the convective mode (or storm organization) and whether a brief tornado could spin up before moving into less unstable air from the Green Mountains eastward.

Figure 10. SPC mesoanalysis valid at 17Z (1 PM) on 26 March 2021, including (a) the surface-6km bulk shear (kt), (b) the storm-relative helicity (contoured, m2s-2) and storm motion (kt), (c) the Supercell Composite Parameter (contoured, dimensionless) and storm motion, and (d) the Significant Tornado Parameter (contoured, dimensionless) and convective inhibition (shaded in intervals of -25 J kg-1).[click to enlarge]
Radar Analysis
With strong large-scale forcing, an impressive line of convection formed east of Lake Ontario during the late morning hours on 26 March 2021. It didn’t take long for the developing line to strengthen within the cyclone warm sector, especially as surface-based instability increased with daytime heating ahead of the line. A combination of unidirectional mid-level shear and veering low-level shear lead to a Quasi-Linear Convective System (QLCS) developing across the North Country. Within this QLCS, there were a number of bowing segments with portions of the bow that showed brief low level rotation. This type of radar reflectivity structure is often referred to as a Line Echo Wave Pattern (LEWP, Fig. 11).

igure 11. Base Reflectivity from the KCXX radar at 1:30 PM (left) and 140 PM (right) show the evolution of the dynamic bow as it moves across Addison County in Vermont. The white ‘X’ denotes where the tornado touched down. Notice the notch as the apex of the bow depicting the rear inflow jet and how it forces the front of the bow to accelerate eastward. In addition, you can see the area where the downdraft wrapped back into the main line of storms in what is referred to as a bookend vortex.[click to enlarge]
As the rear inflow jet fed into the storm, parts of the storm would collapse and create a downdraft which then wrapped back into the bow. These were the primary source of the rotation observed on radar during the late morning and afternoon hours. One such example of the aforementioned rotation was one that moved across Horseshoe Lake, New York during the early afternoon hours but no damage or funnel clouds were reported. As the convective line entered a more favorable environment, the first reports of wind damage began coming in between Schroon Lake, Ticonderoga and Crown Point. By the time the line of storms moved into Vermont, a dynamic bow echo evolved over the southern Champlain Valley and produced scattered wind damage as it moved eastward across Addison and Washington Counties. The tornado that impacted Middlebury, Vermont developed within the areas of enhanced rotation as a downdraft on the northern end of one of the bows wrapped back into the main line of storms. The embedded tornado was short-lived (between 60 and 90 seconds based on the NWS storm survey) which makes it nearly impossible to detect by the WSR-88D as the update time between base reflectivity and velocity data is roughly 3 minutes between low-level scans when Supplemental Adaptive Intra-Volume Low-Level Scan (SAILS) is used.
Around 1730Z (1:30 PM EDT), an enhancement in the base velocity and storm relative velocity fields were noted as a strong downdraft developed on the northern extent of the dynamic bow (Fig. 11). This downdraft appears to have wrapped back into the storm and created a brief rotational velocity couplet between 25 and 30 knots just to the northeast of Middlebury by 1:40 PM (Fig. 13). Dual-polarization data from the KCXX radar was able to detect a decrease in the correlation coefficient (CC) to around 0.7 at 1740Z (1:40PM EDT), which can be used to detect debris from tornadoes (Fig. 12). However, these signatures don’t show up until damage has already occurred. In this case, the debris signature was located to the northeast of where the actual damage was noted by the NWS Storm Survey due to the strong southwest to northwest motion of the storms during the afternoon hours. While no strong mesocyclone was noted on the radar imagery, the brief increase in rotational velocity (~30kt) was associated with the spin up of a brief EF-1 tornado that damaged four households.

Figure 12. A KCXX animated loop depicting the evolution of a localized area of increased spectrum width (knots). Notice at 1741Z (1:41 PM EDT) that the area of highest spectrum width matches exactly with the area of decreased correlation coefficient indicating a tornado debris signature (TDS).[click to enlarge]

Figure 13. A KCXX animated loop (1735-1743Z, 1:35-1:43 PM EDT) depicting the evolution of the storm as it moved across Middlebury, VT. Top left - Base Reflectivity (dBz). Top right - Storm Relative Motion (knots). Bottom left - Correlation Coefficient. Bottom right - Normalized Rotation (s-1). The red dot on all four panels indicates where the tornado damage occurred.[click to enlarge]
Storm Survey
An NWS Storm Survey performed during the early evening on 26 March 2021 determined that a tornado touched down just northeast of Juniper Lane, causing limb damage before throwing a barrel into a house and shattering a window. As the tornado tracked northeastward, multiple softwood trees were either uprooted or had snapped trunks. Once the tornado crossed Painter Road, it forcibly removed an attached garage from a house, caused a full collapse of the garage and did significant damage to the shingled roof. A car was also flipped on its side at the residence. As the tornado continued to move northeastward, it removed roofing from multiple farm buildings and uprooted additional softwood trees. Once the tornado moved northeast of the farm, it entered a field where it snapped over a dozen additional trees at mid-trunk level before dissipating over the field. This tornado injured two people during the brief touchdown.
Start Location: 1.4 miles northeast of Middlebury in Addison County in Vermont at the end of Juniper Lane
End Location: 2.0 miles northeast of Middlebury in Addison County in Vermont north of Painter Road
Date/Time: 1:40-1:41 PM on March 26, 2021
Estimated Max Wind Speed: 110 MPH
Maximum EF-Scale Rating: EF1
Maximum Path Width: 75 Yards
Injuries: 2
Fatalities: 0
For Reference, here is the EF-Scale:
EF0...Weak......65 to 85 mph
EF1...Weak......86 to 110 mph
EF2...Strong....111 to 135 mph
EF3...Strong....136 to 165 mph
EF4...Violent...166 to 200 mph
EF5...Violent...>200 mph

Figure 14. This picture was taken north of Painter Hill Road where the most significant damage associated with the short-lived tornado occurred. Shingle damage to both the north and south facing side of the house was noted. In addition, an attached garage was removed from the foundation and thrown 10 feet where it collapsed. This damage is what led the survey team to rate the tornado as a high end EF-1.[click to enlarge]

Figure 15. Between 6 and 12 large softwood trees were completely uprooted with many of these trees falling on powerlines. In addition, 12-24 softwood trees were snapped at mid-trunk level both north and south of Painter Hill Road.[click to enlarge]

Figure 16. This is the final map created by the survey team up completion of the storm survey. The Blue triangles denote where EF-0 damage was observed while the green triangles denote where EF-1 damage occurred. The shaded area shows the width of the tornado during the brief touchdown.[click to enlarge]

