
A Wind Advisory is in effect for majority of the region from 8AM to 8PM Tomorrow for southerly winds gusts between 45 and 55 MPH. There will be two rounds of gusty winds with the first tomorrow morning for most of the area and the second mainly over northern New York. The strongest winds will be between 9AM and 1PM in the CPV, western facing slopes of the higher terrain and the St. Lawrence Valley Read More >
 Email the authors
Introduction:
Late March 9th, an area of low pressure began to lift north from the southeastern United States towards Vermont and northern New York. This area of low pressure interacted with a decaying low and associated frontal boundary west of the St. Lawrence River, and then the low deepened as it tracked along the New England coastline. The bulk of rain and snow came in two separate waves. The first period of widespread rain and snow occurred as surface low pressure moved towards the Mid-Atlantic and Long Island. As the surface low shifted towards coastal New England and continued to intensify, mid-level cold advection and height falls resulted in deep, saturated profiles that began the second phase of widespread precipitation as snow blossomed across the region again Sunday evening through Monday. Orographic lift and vorticity advection from a digging upper level low to the north were the primary sources of lift that produced moderate to heavy snow on and downwind of mountain summits.
Forecast accumulations favored Vermont with 16 to 24 inches at summit levels along the Greens, and east of the Green Mountains observed 5 to 10 inches. Along the Champlain Valley, 1 to 5 inches was observed with less than one inch across the St. Lawrence Valley. Reports were sparse across the Adirondacks, but 4 to 12 inches were likely observed, with the highest totals in Essex County, New York. Our forecast across Vermont was generally good, but the forecast across northern New York was generally too high (Figure 1). We will examine the system's two phases and why the synoptic pattern suggested the potential for heavy, wet snow, and how complex interactions played a part in the lower than expected snowfall amounts across northern New York.
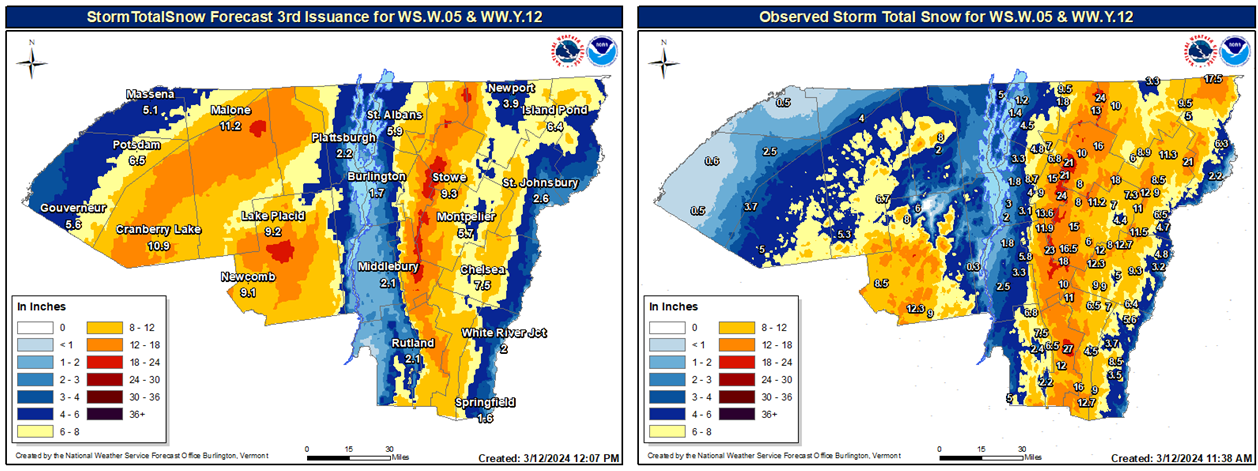
Figure 1: Left) Forecast snowfall accumulation for the last package before the storm began across Vermont and northern New York. Right) Preliminary observed snowfall totals through 11 March 2024 across Vermont and northern New York.[click to enlarge]
There were many challenging aspects to this event. Forecast uncertainty in the medium range was high. Still, even as model low tracks converged, marginal surface temperatures and where the best forcing would be positioned resulted in frequent adjustments. In these situations, a degree temperature difference could change the forecast by as much as 6 inches. Additionally, a period of strong southeast flow would produce terrain shadowing and adiabatic warming along western slopes. High-resolution models usually capture this better, and at shorter lead times are incorporated into the National Blend of Models (NBM). This led to sharper depictions of terrain enhancement prior to the event. However, this shifted the forecast in the wrong direction across parts of eastern Vermont and the northwest slopes of the Adirondacks (Figure 2).
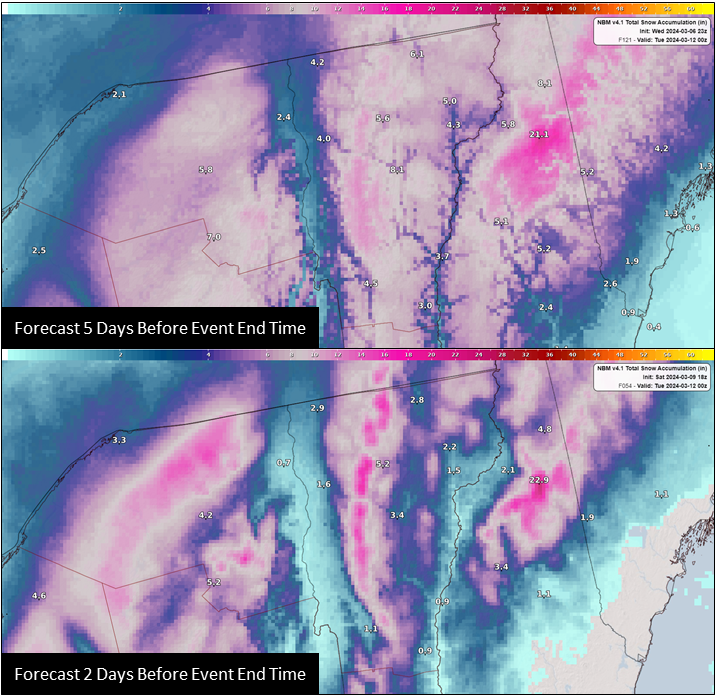
Figure 2: Two forecasts for Vermont and northern New York from the National Blend of Models version 4.1. On top is a forecast made Wednesday, 6 March 2024 five days before the end of the event on 00z Tuesday, and on bottom is a forecast made Saturday, 9 March 2024 2 days before the end of the event on 00z Tuesday. It should be noted on the 5-day forecast that there were a few forecasts of 0.1” of snow at various times before 10 and 11 March 2024.[click to enlarge]
Section 2: Synoptic Weather Pattern
The most favorable indicators for heavy, wet snow were warm temperatures in the lowest 200mb and a deepening upper low with strong, vertical motion due to several factors. Within the complex interaction of two upper level systems, there were two distinct rounds of precipitation. Between this was a period of mid-level dry air, and then a transition to snow showers with an increase in the depth of the dendritic growth zone (DGZ) that would enhance the efficiency of snowfall production from the evening of March 10th into March 11th. Figure 3 shows the different phases of this event at MPV.
Figure 3: NAM 4km forecast skew-T diagram at MPV between 21z 9 March 2024 through 12z 11 March 2024 in three-hour intervals. The red line indicates temperature and the green line indicates dewpoint. The boxes on the left show relative humidity and saturation with respect to ice at various levels. Wind barbs on the right depict wind direction and speed. The dendritic growth layer is highlighted and becomes yellow in saturated, but remains pink while unsaturated.(From NOAA/Storm Prediction Center)[click to enlarge]
The most favorable window of precipitation occurred near and after midnight on March 10th, as a cold front began to move east as surface low pressure tracked towards Long Island. Precipitation began to arrive late on March 9th as isentropic lift associated with deep southeasterly flow advected PWATs of about 0.70” into the region. Confluent flow based on the positioning of surface high pressure in the Canadian Maritimes and low pressure north of Ottawa funneled abundant moisture northwards, allowing for several rounds of precipitation into the overnight hours. RAP mesoanalysis also depicted a sharp thermal gradient across Vermont at 09z 10 March 2024, which corresponded with the increased frontogenetic (FGEN) forcing that progressed north. However, the best moisture transport and coupling of low level convergence and upper divergence appeared to have occurred around 05z 10 March 2024. The lagging of higher FGEN behind synoptic scale forcing may have contributed to a weakening of the band as it lifted north through Vermont (Figure 4).
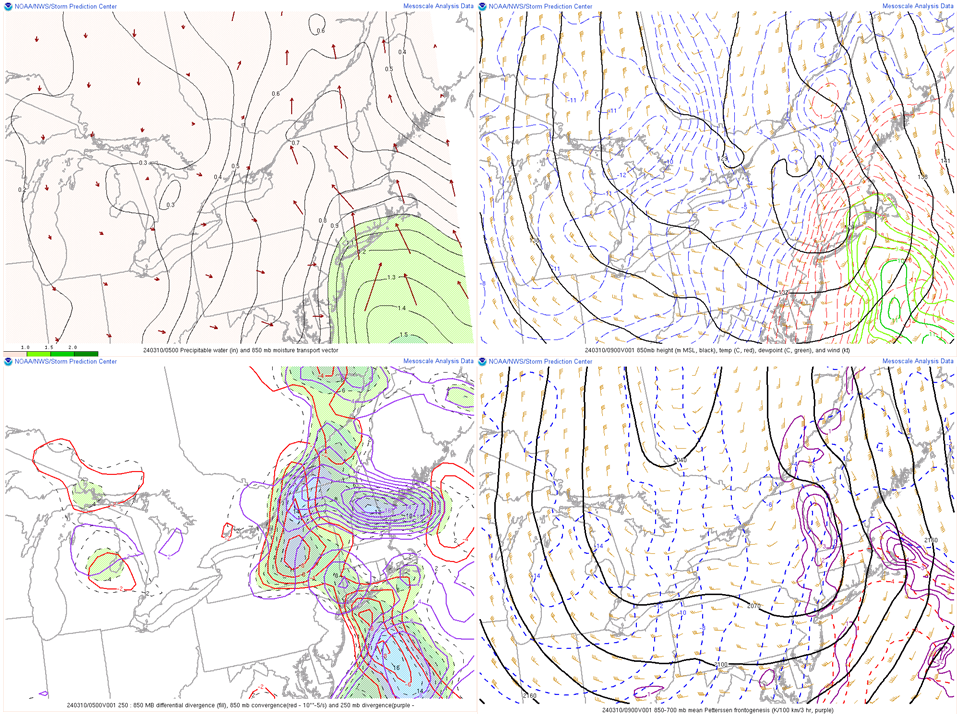
Figure 4: Top Left) RAP mesoanalysis at 05z 10 March 2024 with moisture transport vectors at 850mb and precipitation water values. Values over 1 inch are shaded green. Bottom left) RAP mesoanalysis at 05z 10 March 2024 of low level convergence and upper level divergence. Top Right) 850mb winds and thermal gradients at 09z 10 March 2024. Bottom Right) RAP mesoanalysis at 09z 10 March 2024 of 850-700mb frontogenesis and temperatures with wind barbs showing mean layer flow. (From NOAA/Storm Prediction Center)[click to enlarge]
Almost a year before, our region had faced a situation involving a pivoting mesoband that shifted further west than anticipated. We utilized research from Kenyon 2013 with conceptual models of the type of mesobands and the atmospheric conditions that favor these features. Based on the position of an upper level low well to the west while a developing surface low lifted towards Long Island was indicative of a laterally translating band (Figure 5). Although the upper level jet structure did not fit any of the conceptual models, high-resolution guidance accurately depicted the mesoband lifting northward.
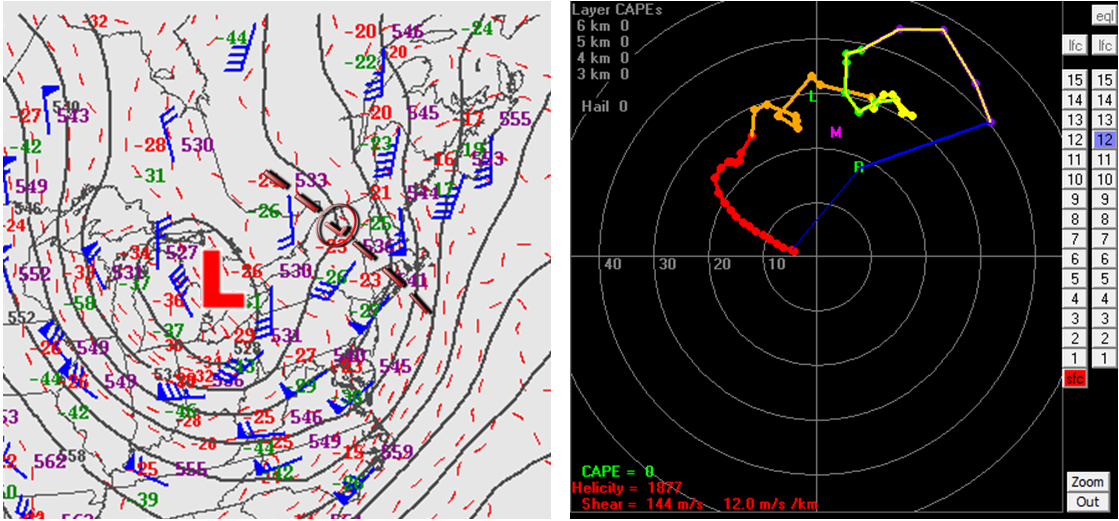
Figure 5: Left) 500mb SPC upper air analysis at 12z 10 March 2024 with the upper level low and trough features annotated. Right) NAM 4km forecast hodograph at 07z 10 March 2024 for KMPV from the SFC to 12km above the ground when the heaviest snow was lifting north. The transition from east wind to southwest winds aloft is consistent with a laterally translating mesoband.[click to enlarge]
During the period of heaviest precipitation, much of the Champlain Valley and northern New York observed temperatures in the mid to upper 30s and precipitation type remained as rain. There was a large degree of local variability in the region of rain or snow that was mainly dependent on elevation. The initial area of enhanced vorticity began to lift north on the morning of March 10th. As stronger forcing lifted out of the region, the initial phase of the storm concluded. Precipitation began to scatter as surface low pressure shifted eastwards, but never completely ended as a surface cold front tracked east. Daytime heating and lack of precipitation warmed temperatures back into the upper 30s to upper 40s (Figure 6).
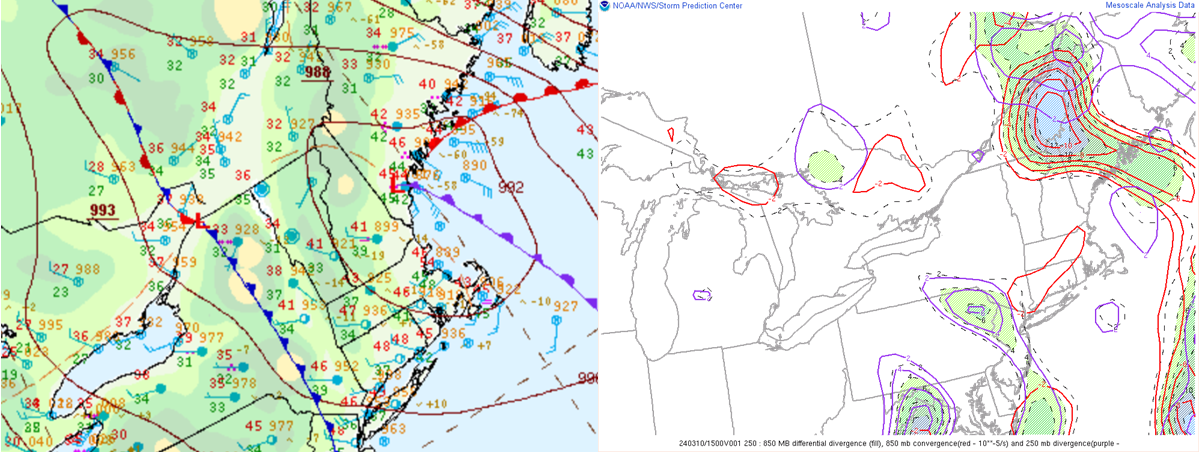
Figure 6: Left) WPC surface analysis at 15z 10 March 2024 when precipitation was in a lull. Right) RAP mesoanalysis at 15z 10 March 2024 of low level convergence and upper level divergence seen lifting northeast of Vermont.[click to enlarge]
The second phase of the system developed late Sunday afternoon and evening. Surface low pressure began to move well east into Maine. In the upper levels of the atmosphere, a complex interaction began between two upper level lows that produced a gyre. Within the gyre, rounds of moisture shifted southeast Sunday evening into Monday, March 11th while the surface cold front moved east across Vermont. Early Monday morning, the surface cold front and the coastal low began to coalesce in eastern Maine. After remaining as two distinct features, the two upper level lows involved in the gyre also began to merge. This resulted in a period of enhanced vorticity advection and upper divergence as the upper low near Montreal dived back towards the southeast, moving over Vermont on Monday, which focused snow showers across Vermont (Figure 7). It was at this time that the orographic snow showers became most intense and snow-to-liquid ratios also increased. The merged upper low tracked east during the day, and dry air began to end precipitation from west to east Monday evening.
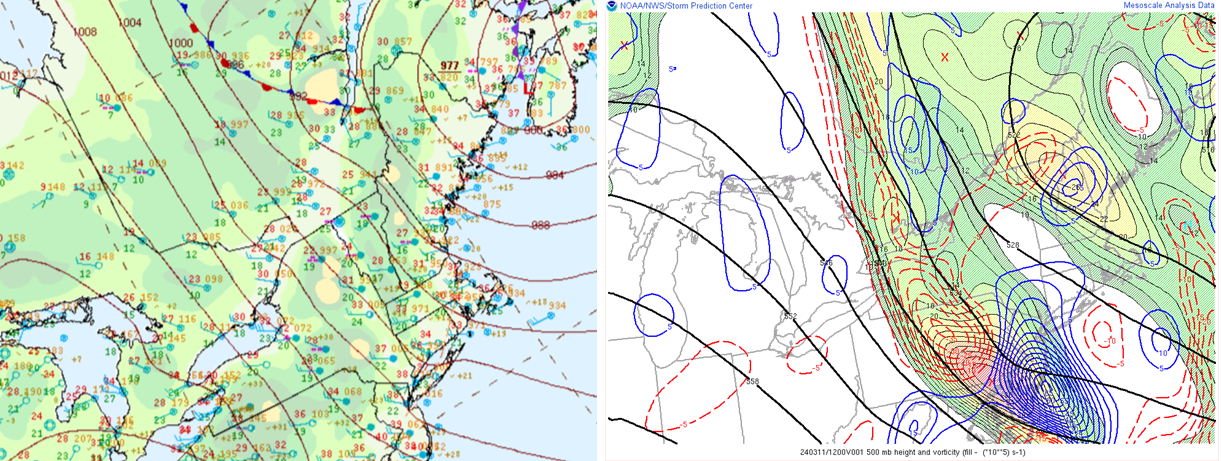
Figure 7: Left) WPC surface analysis at 12z 11 March 2024 depicts a 977mb low between Quebec Province and Nova Scotia. Right) RAP mesoanalysis at 12z 11 March 2024 of 700-400mb differential vorticity. Stronger areas of vorticity are shaded in red. Cyclonic vorticity advection is contoured in blue (favorable for rising motion), and anticyclonic vorticity advection (unfavorable for rising motion) is contoured in red.[click to enlarge]
Section 3: Forecast Challenges
Temperatures were extremely challenging for this event. Due to a below normal snowpack across the region, and what was one of the warmest winters on record, there was not much cold air available with this system, and a period of deep southerly flow prevented any cold air from across Canada from shifting towards Vermont and northern New York. Much of the cooling that took place occurred from dynamical cooling within moderate to heavy precipitation and decreasing thicknesses as the upper level low developed. The evolution of snowfall was also complicated by the track of the surface low. Before shifting into interior New England, the surface low track remained south of model clusters and hugged the coastline (Figure 8). As a result, the best heavy precipitation remained mainly east of the Adirondacks. Parts of northern New York observed light precipitation rates and temperatures that remained in the lower 40s within the first round of precipitation. During the second phase, the phasing of the two upper level lows did not occur until they merged in the Gulf of Maine (Figures 7 and 14). Much of the forcing Sunday evening into Monday morning took place as the upper level low near Montreal dug southeast as it began to assimilate. This occurred later than expected and resulted in waves of precipitation as opposed to sustained orographic precipitation, which is most favorable when the upper low is quasi-stationary.
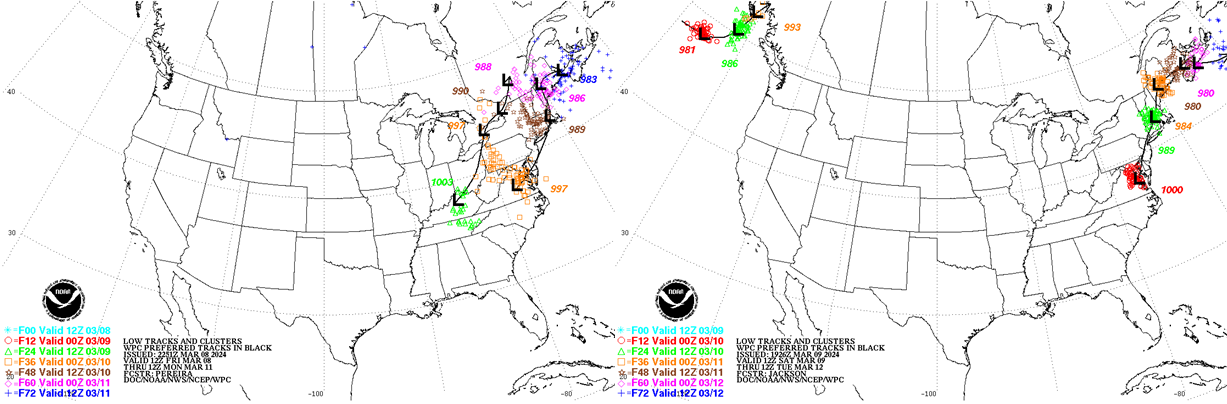
Figure 8: Left) WPC low track issued 2251z 8 March 2024 and Right) WPC low track issued 1926z 9 March 2024. Between the two days, one can observe the shift southeast in model clusters. The observed low track would be somewhat faster and remained closer to the Maine Coast (not shown).[click to enlarge]
Any multi-phase event that results in a long duration of snowfall presents challenges over forecast communication about the evolution and timing of events. Figure 9 provides a sample of the nested 4km NAM forecast with the different phases of the system across MPV on top and SLK below to provide some comparisons. At MPV, the two phases are much more distinct, with a period of stronger forcing as the mesoband lifted into Vermont which would remain east of SLK. On the other hand, there was less dry air intrusion over SLK, and being located further west of the coastal low, cold advection was forecasted to produce a slow, but steady accumulation of snow. Within the overview of the vertical motion and available moisture within the overview, there were signals to indicate the potential for MPV to receive more snowfall than SLK. Despite the period of more marginal temperatures and the longer duration of dry mid-level air, the very strong forcing with the first round, and then greater moisture and upward motion within the dendritic growth zone were forecast during the second round. These tools can provide valuable insights to forecasters assessing probabilistic data and determining how to follow model trends.
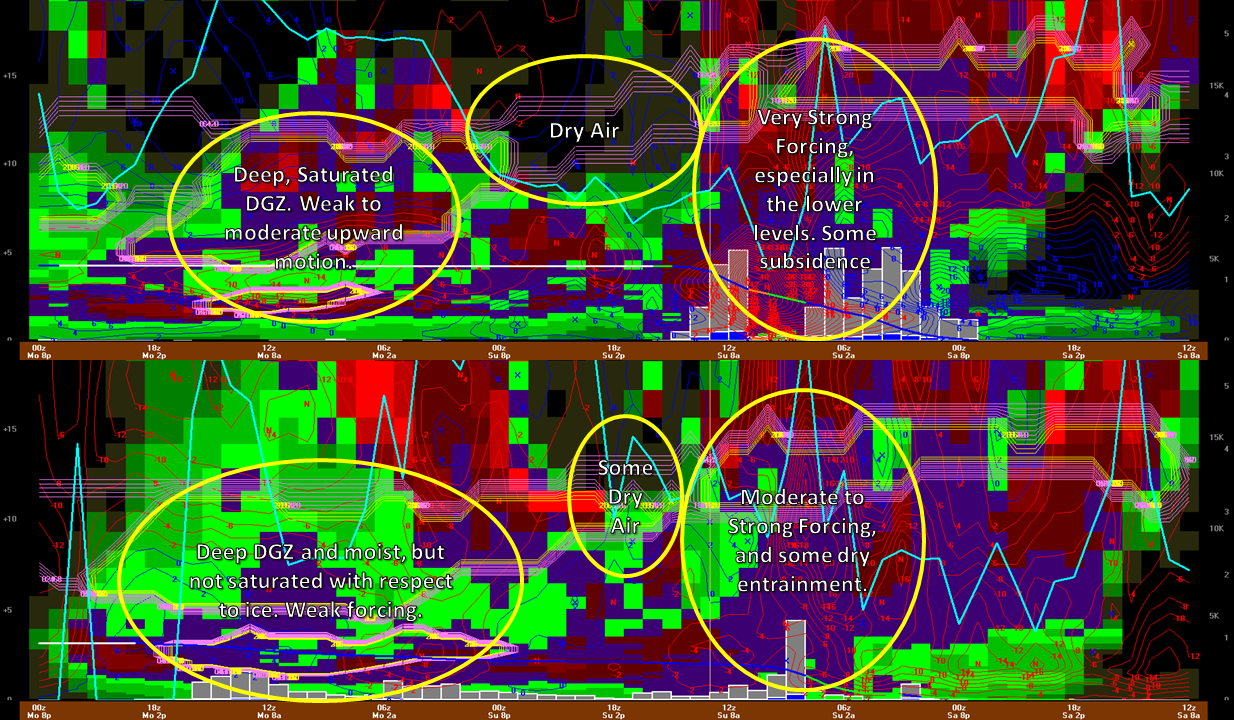
Figure 9: Top) MPV NAM 4km forecast 12z 9 March 2024 through 00z 12 March 2024 with moisture shaded in colors of green, then purple and red for areas saturated with respect to ice, vertical motion contoured in red (rising) and blue (sinking), snow to liquid ratios in the blue line, and the dendritic growth layer contoured. The figure has been annotated to show the different phases of the storm. A bar graph shows liquid equivalent precipitation and snowfall forecast. Bottom) The same, but for SLK to compare with MPV. Images generated through BUFKIT[click to enlarge]
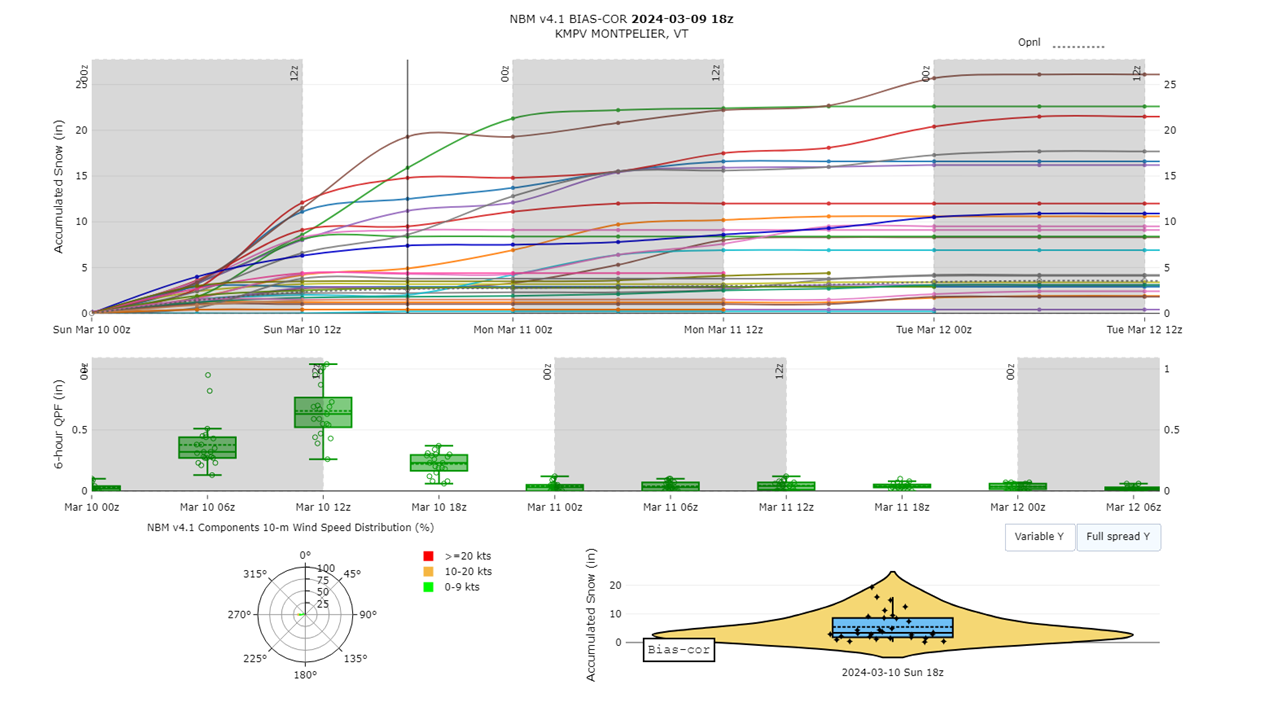
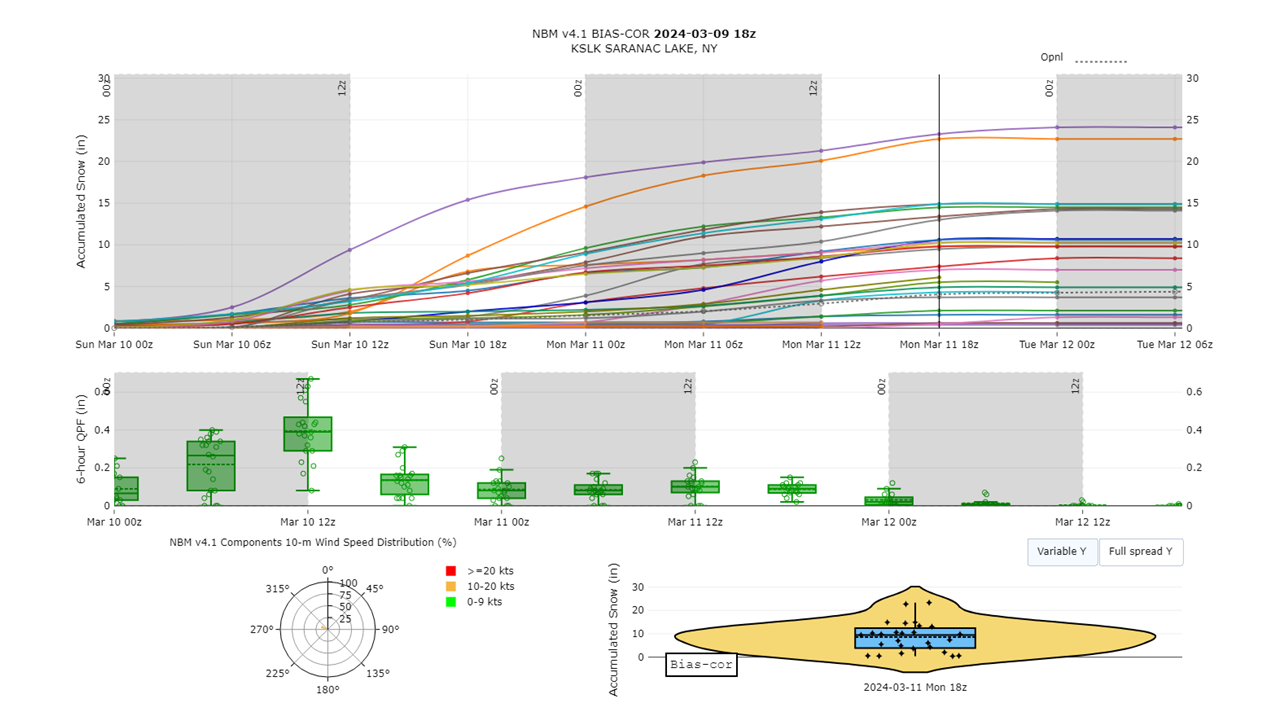
The forecast range among model snowfall accumulation forecasts was high, which is common in elevation-dependent, long-duration events such as this one. Two sets of charts with probabilistic information for Montpelier, Vermont (MPV), and Saranac Lake, New York (SLK) through 06z Tuesday are shown in Figure 10. The top chart is a forecast plume generated from the different models assimilated in the National Blend of Models (NBM). This helps visualize model clustering and where outliers exist. The second chart in the center is a box and whisker diagram of the 6-hour quantitative precipitation forecast (QPF). This information is useful for determining the potential snow-liquid ratios and how much snow loading may occur on power lines. We will not analyze the wind rose on the bottom left, but will assess the violin chart on the bottom right. A box and whisker diagram is embedded in the violin and individual members are plotted as well. The shaded area of the violin extends farthest out where the majority of models are located, which is most useful for finding bi-modal distributions. In this case, this is a helpful tool in showing how snowfall totals were skewed towards lower accumulations. As noted within Figure 9 comparing the moisture and vertical motion over time during the event, SLK was forecast to observe a slow and steady accumulation of snow compared with a sharper rise across MPV. This was partly due to a lower QPF forecast later in the forecast. Looking at the individual members mapped on the violin, forecast snowfall accumulations were clustered towards lower values at MPV, but more distributed at SLK (Figure 10). Using the information from tools like vertical motion and moisture content over time like Figure 9 can be a useful way to make decisions about model uncertainty, especially for situations like MPV that had suggested the potential for higher snowfall amounts than the median forecast.
Section 4: Radar and Satellite Observations
During the first phase of the storm, waves of moisture lifted north late March 9th into the morning hours on March 10th. Fluctuating radar reflectivities indicate the waves of precipitation on Multi-Radar Multi-Sensor (MRMS) imagery. Each surge was stronger than the next, which resulted in falling snow levels over time. Precipitation initially began at the summit levels Saturday evening and Saturday night. After March 10th at 02z, snow levels began to fall across eastern Vermont and Essex County in northern New York. The last surge occurred between 06z and 10z on March 10th which was associated with a mesoband that lifted north with the surface low. The highest reflectivity remained concentrated east of the Adirondacks. Close to the Colchester radar, very high reflectivity as high as 55 to 60 dBZ indicated the intensity of brightbanding with melting snow. By late Sunday morning on March 10th, a mix of snow began in the Champlain Valley as temperatures began to cool and upper level vorticity lifted north of the international border after 15z Sunday, March 10th. Temperatures remained too warm across the St. Lawrence Valley for snow to mix in Sunday morning (Figure 11).
Figure 11: MRMS in one-hour increments from 11 AM Saturday, March 9th through 11 AM Sunday, March 10th. Note this does not take into account daylight savings. The estimated precipitation type of rain or snow is shaded. (From NOAA/Global Systems Laboratory)[click to enlarge]
Figure 12 shows water vapor satellite imagery in one hour increments from 04z to 13z 10 March 2024, which shows the evolution of the mesoband lifting north. It also depicts the interaction between the two areas of strong vorticity lifting across interior New England and another descending across the Ohio River Valley. Shades of blue and green show regions where water vapor existed at higher altitudes, which can indicate where stronger upward forcing is occurring or where greater mid to upper level moisture is present. In snowfall events, this is useful since dendritic growth occurs in the mid-levels of the atmosphere. Shades of orange or red show where dry air is present which would limit precipitation. The beginning of the satellite loop shows cold cloud tops in association with the mesoband mainly east of the Adirondacks extending into Maine. Dry air briefly shifted into Vermont. However, as the cyclone matured, evidence of convective enhancement can be observed in eastern Vermont and into the Northeast Kingdom from 11z to 13z on Sunday, which coincides with moderate snow that lifted across eastern Vermont on radar.
Figure 12: Lower level water vapor (channel 10 or 7.3µm) from 04z to 13z 10 March 2024. Orange and red colors indicate areas of dry air. Gray, blue, and green colors indicate increasing returns from moisture to the satellite at higher altitudes. A curl associated with one upper level system can be seen digging into the Ohio River Valley, and another curl can be seen lifting north of Vermont. Images compiled through RAMMB/CIRA.[click to enlarge]
Figure 13 shows the satellite depiction of the second phase from 00z to 15z 11 March. Due to how slowly the phasing of the upper level low took place, the surface cyclone tracked across New England. Surface pressures only gradually fell while a lingering surface trough extended across Ottawa that prevented a transition to northwest winds. As a result, this prevented sustained upslope snow. Instead, there were waves of rain or snow showers propagating southeast of the upper low north of the international border Sunday evening into Monday. This spread out snowfall into areas outside typical northwest upslope events, with additional snowfall occurring in the southern Champlain Valley and parts of eastern Vermont. Watching the satellite loop, one can observe colder cloud tops that descended mainly across Vermont as opposed to northern New York. At the end of the satellite loop, the curl of the upper level low was observed north of Montreal digging southeast towards Vermont as the two upper level systems began to merge. The focus of these waves of enhanced moisture favored Vermont. The lack of northwest flow and how the curl tucked further east towards Vermont are all indicators of how small displacements in these features or the wind direction affected the outcome of snowfall across northern New York.
Figure 13: Lower level water vapor (channel 10 or 7.3µm) from 00z to 15z 11 March 2024. Orange and red colors indicate areas of dry air. Gray, blue, and green colors indicate increasing returns from moisture to the satellite at higher altitudes. This shows a curl north of Vermont that is stretched apart as it merges with the deepening upper low near Nova Scotia. Images compiled through RAMMB/CIRA.[click to enlarge]
Examining the radar loop during this time frame, surges of higher reflectivity were again observed during the second phase of the event. Precipitation tended to propagate southeast as opposed to becoming anchored over terrain, especially across northern New York. This is also with the unblocked flow that was generally observed (not shown). Once the upper level systems combined Monday, March 11, then conditions became more favorable for orographically enhanced snow showers. However, the southeastward pull of vorticity noted earlier favored Vermont while allowing dry air to quickly entrain across northern New York Monday afternoon (Figure 14).>
Figure 14: MRMS in one-hour increments from 4 PM Sunday, March 10th through 4 PM Monday, March 11th. The estimated precipitation type of rain or snow is shaded. (From NOAA/Global Systems Laboratory)[click to enlarge]
Section 5: Downslope and Post Frontal Winds
The potential for strong winds was closely watched with this event as well. Due to the likelihood of heavy, wet snow, there was concern that gusty winds would exacerbate power outages and downed trees across the region. As with the precipitation, strong winds occurred in two separate phases. The first occurred ahead of the surface low Saturday evening into the overnight hours when channeled mid-level winds between a 1026mb surface high near the Canadian Maritimes (not shown) and the approaching cold front resulted in a 60 to 70 knot southeasterly jet around 850mb (Figure 15).
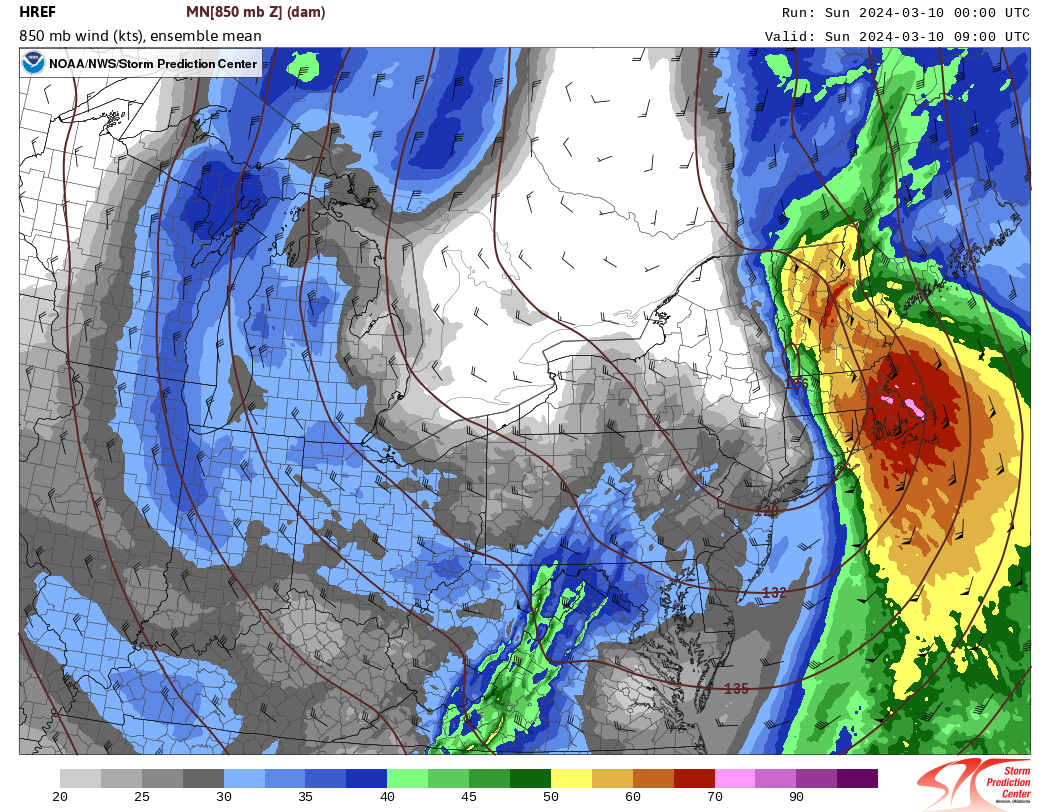
Figure 15: HREF forecast 850mb mean winds with speeds shaded and wind barbs plotted valid Sunday 09z 10 March 2024. Geopotential heights at 850mb are also contoured.[click to enlarge]
The primary question would be how strongly winds could mix to the surface given the precipitation and the proximity of the developing mid-level low. Additionally, the inversion layer was located about 1000 feet above ground level across areas like Rutland and Malone (not shown). Most downslope wind events occur when the inversion layer is located near ridge tops about 3000 to 4500 feet above sea level. In this initial phase, the early arrival of precipitation across southern Vermont resulted in wind gusts primarily between 35 and 45 mph, while across northwestern slopes of the Adirondacks in areas like Malone, wind gusts reached about 50 mph (Figure 16).
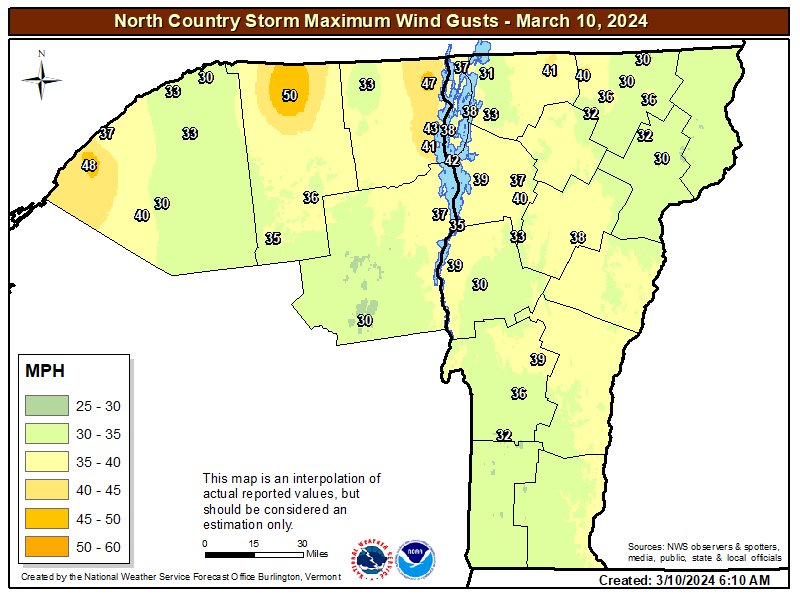
Figure 16: Maximum wind gusts over 30 mph observed 12z 9 March through 12z 10 March 2024.[click to enlarge]
As the surface low tracked along New England and the decaying surface front translated east, wind speeds decreased across the region. As the surface low deepened to 977mb on Monday east of Maine, mid-level flow accelerated again. Mid-level cooling resulted in a deep mixed layer during the daylight hours. During the afternoon, a low-level jet was expected to develop while the northern upper low began to dive southeast and merge. The timing of when 850mb winds would be greatest at 50 to 60 knots was after peak heating, which likely kept mixing from reaching its maximum potential (Figure 17). West-northwest winds favored parts of northern New York and areas east of the Green Mountains with observed gusts between 40 and 48 mph (Figure 18).
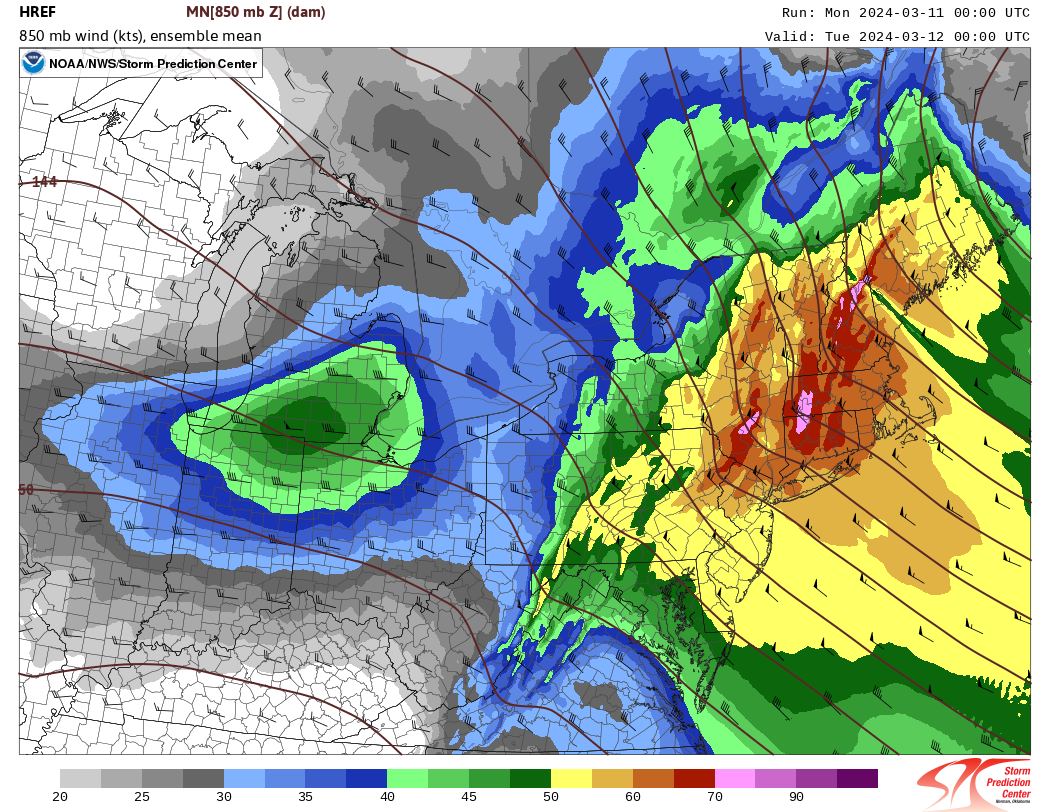
Figure 17: HREF forecast 850mb mean winds with speeds shaded and wind barbs plotted valid Sunday 00z 12 March 2024. Geopotential heights at 850mb are also contoured. [click to enlarge]
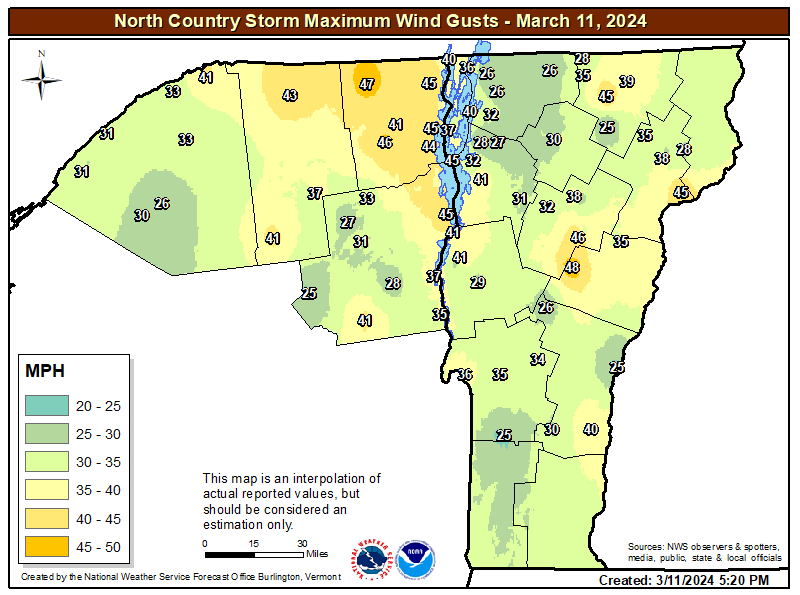
Figure 18: Maximum wind gusts over 25 mph observed 21z 11 March through 21z 11 March 2024.[click to enlarge]
Section 6: Summary
Heavy, wet snow and strong gusty winds resulted in scattered power outages across the region. Over 25000 people across Vermont lost power during the event. Across New York (including outside our forecast area), NYSEG reported 33000 customers without power in a news release, with impacts mainly south of our area of responsibility. With such unseasonably warm conditions across the area much of the winter, the 16 to 22 inches of snow observed across our mountain summits was a welcome change of pace for outdoor recreation.
A lot of time has been spent analyzing what is a relatively common late-winter event. This event is far from the most impactful of March winter storms, but the notable overforecast of snowfall across northern New York warranted a second look (Figure 19). The timing of how two upper level lows merged and subtle track elements resulted in less favorable conditions for sustained upslope snow over the northwestern slopes of the Adirondacks. These complex interactions can be challenging to assess when forecast uncertainty is as high as it was. Recognition of these subtle features can help influence how the “expected” forecast point might compare to probabilistic data.
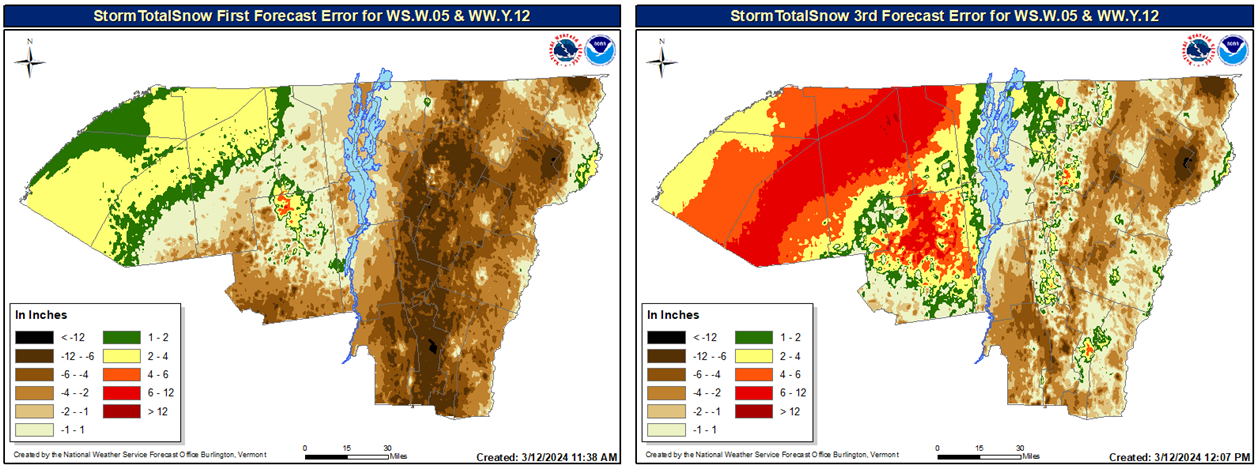
Figure 19: Left) Forecast error from the first storm total snowfall coincident with the Winter Storm Watch issued. Right) Forecast error from the final issuance before the storm began. Brown colors indicate forecast snowfall that was too low and becomes darker with greater error. Greens, yellows, and reds indicate forecast snowfall that was too high. The comparison helps to show whether we went in the right or wrong direction with the forecast update closer to the event.[click to enlarge]
References
Figure 3: Visualized through BUFKIT: NWS\OCLO Warning Decision Training Division: BUFKIT (weather.gov).
RAP Mesoanalysis and HREF forecast images archived by the Storm Prediction Center.
Surface Observation and forecast low track plots are provided through the Weather Prediction Center.
Mesobanding conceptual models based on research from Kenyon’s M.S. Thesis 2013 and visuals on Albany CSTAR.
A press release from NYSEG regarding utility impacts is available here>.
Radar imagery (Figures 11 and 14) generated by the Global Systems Laboratory.
Satellite imagery (Figures 12 and 13) generated by RAMMB/CIRA.

