 |
 |
||||||||||||||||||||||||||||||||||||||||||||||||||||||||||||||||||||||||||||||||||||||||||||||||||||||||||||||||||||||||||||||||||||||||||||||||||||||||||||||||||||||||||||||||||||||||||||||||
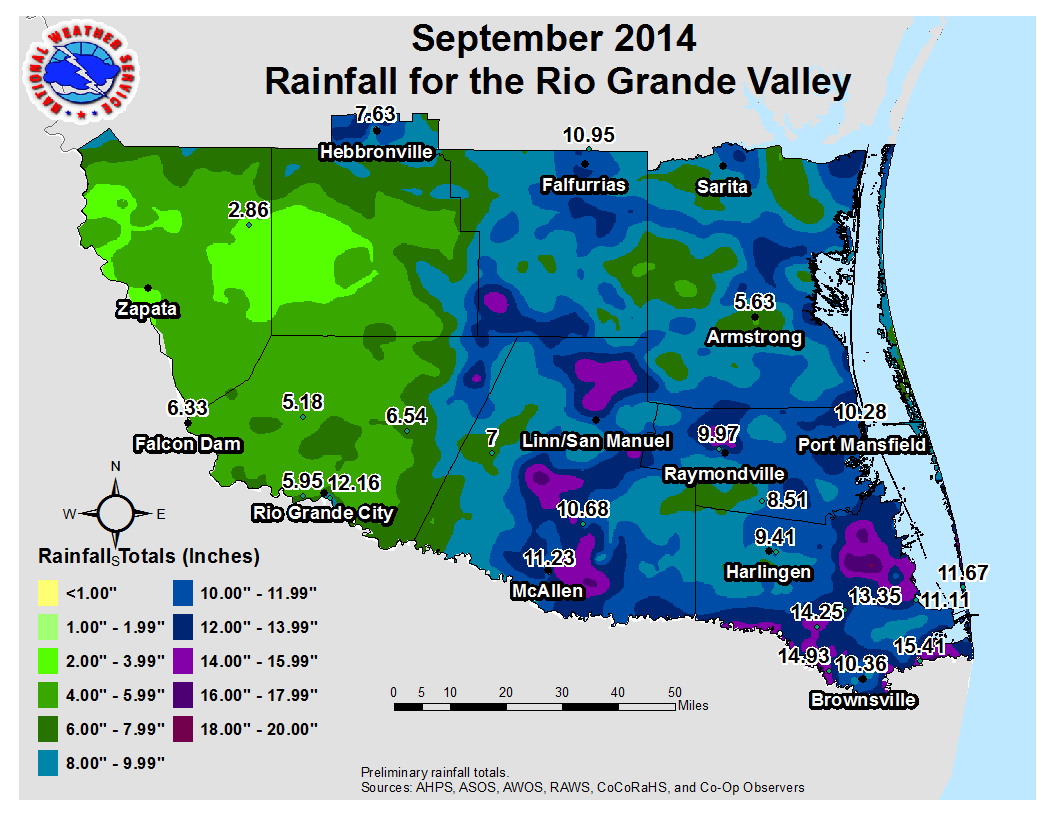
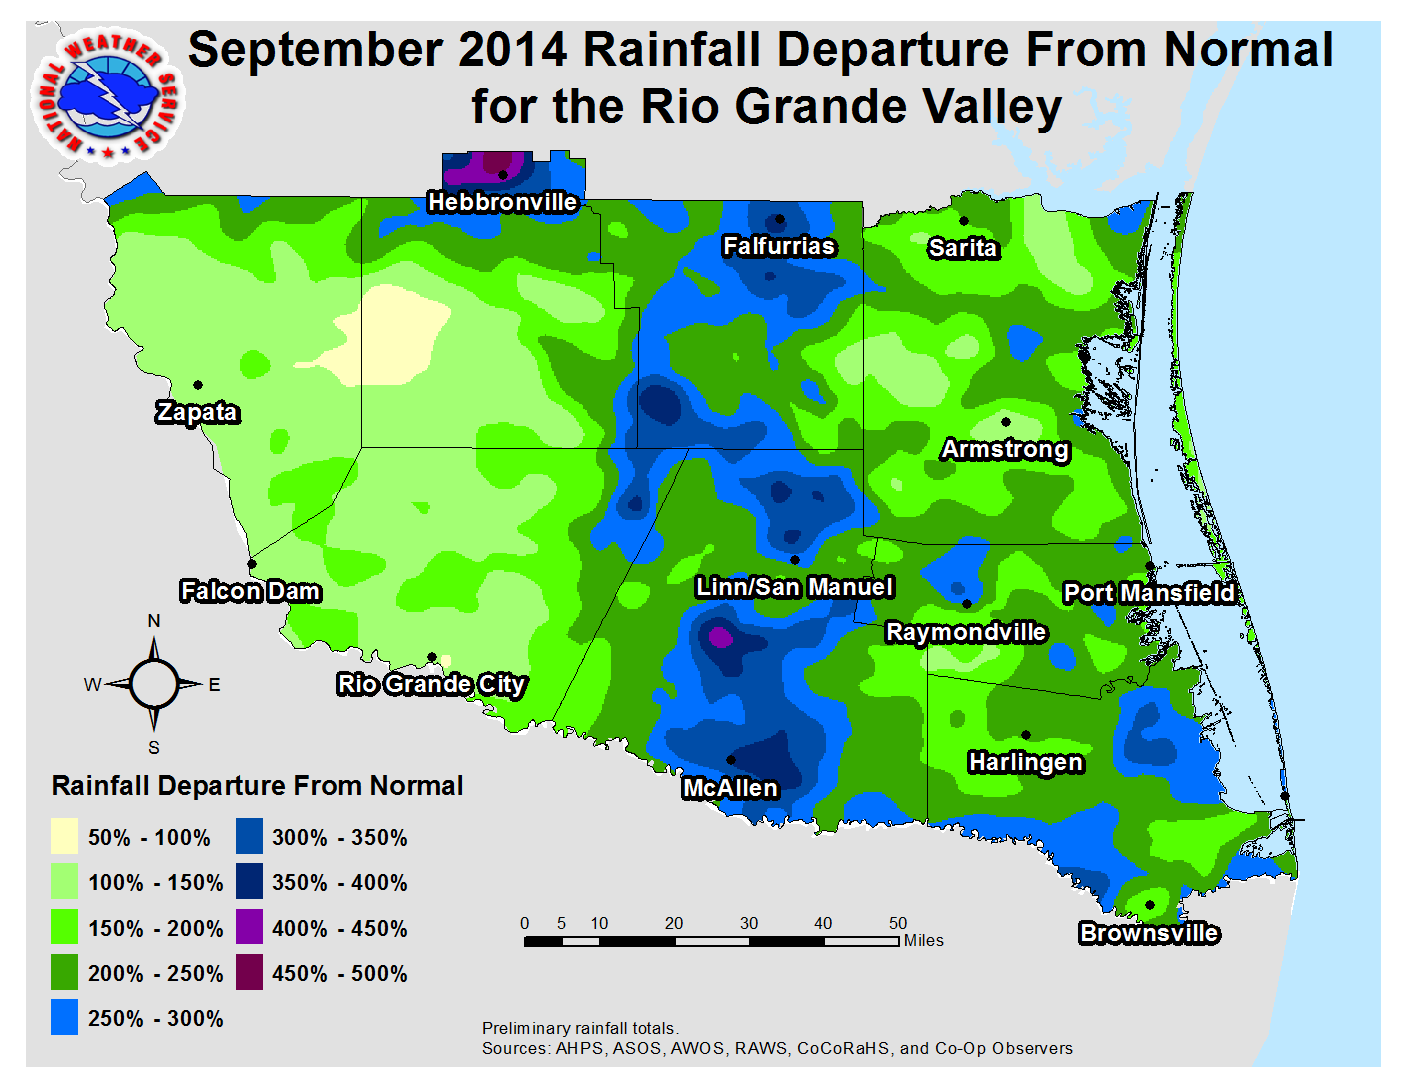
| Rainfall (left) and percent of the 1981–2010 average rainfall (right) for September 2014 in the Rio Grande Valley. Click for full size version. | |||||||||||||||||||||||||||||||||||||||||||||||||||||||||||||||||||||||||||||||||||||||||||||||||||||||||||||||||||||||||||||||||||||||||||||||||||||||||||||||||||||||||||||||||||||||||||||||||
| "Wet–Tember", Indeed! September 2014 Ends as Wettest Single Month in RGV since July 2008 Entire Region Turns Green as Drought Ends; Month Ends Among Top Fifteen Wettest for Most |
|||||||||||||||||||||||||||||||||||||||||||||||||||||||||||||||||||||||||||||||||||||||||||||||||||||||||||||||||||||||||||||||||||||||||||||||||||||||||||||||||||||||||||||||||||||||||||||||||
|
After a relatively dry and hot summer of 2014, September turned the tables in a big way for nearly all of South Texas, from the Rio Grande Valley northward to the Coastal Bend and Rio Grande Plains between Corpus Christi and Laredo. As August ended, the atmospheric pattern segued from La Canícula to one that featured a general flow from the deep tropics of the southern Gulf and western Caribbean. Embedded within the pattern were a series of heavy–rain–triggering events, including the outer bands of Tropical Storm "Baby" Dolly on September 3rd, a tri–fecta of weak easterly(tropical) waves from September 12 through 15, and finished by a combination of upper level energy emanating from west Texas with persistent rich low and mid level moisture from the Gulf between September 26 and 28. The heavy rain produced areas of flooding in urban areas, waterlogged ranches and open farmsteads, and pushed several normally dry or low–flowing arroyos into raging creeks and in one case (Arroyo Los Olmos, Starr County) overflowed banks into nearby neighborhoods. Dozens of homes sustained some level of water damage, some roadbeds were turned into wet gravel, and deep potholes became common on older paved roads. Mosquitoes hatched and swarmed in areas where high standing water was prevalent. For others, the prodigious rains turned summer’s aridity to a lush tropical green. The month’s frequent rain and resultant cloud cover returned temperatures close to their 30–year averages. The streak of 100°F days in the mid Valley became a distant memory; McAllen, which appeared well on its way to closing in on more than 60 such days in 2014 after 24 of the first 27 days in August reached the benchmark, failed to reach the century mark after August 27th, when the rains began. Average temperatures at the three primary airports, and their departure from the 1981–2010 average, were as follows:
|
|||||||||||||||||||||||||||||||||||||||||||||||||||||||||||||||||||||||||||||||||||||||||||||||||||||||||||||||||||||||||||||||||||||||||||||||||||||||||||||||||||||||||||||||||||||||||||||||||
 |
 |
||||||||||||||||||||||||||||||||||||||||||||||||||||||||||||||||||||||||||||||||||||||||||||||||||||||||||||||||||||||||||||||||||||||||||||||||||||||||||||||||||||||||||||||||||||||||||||||||
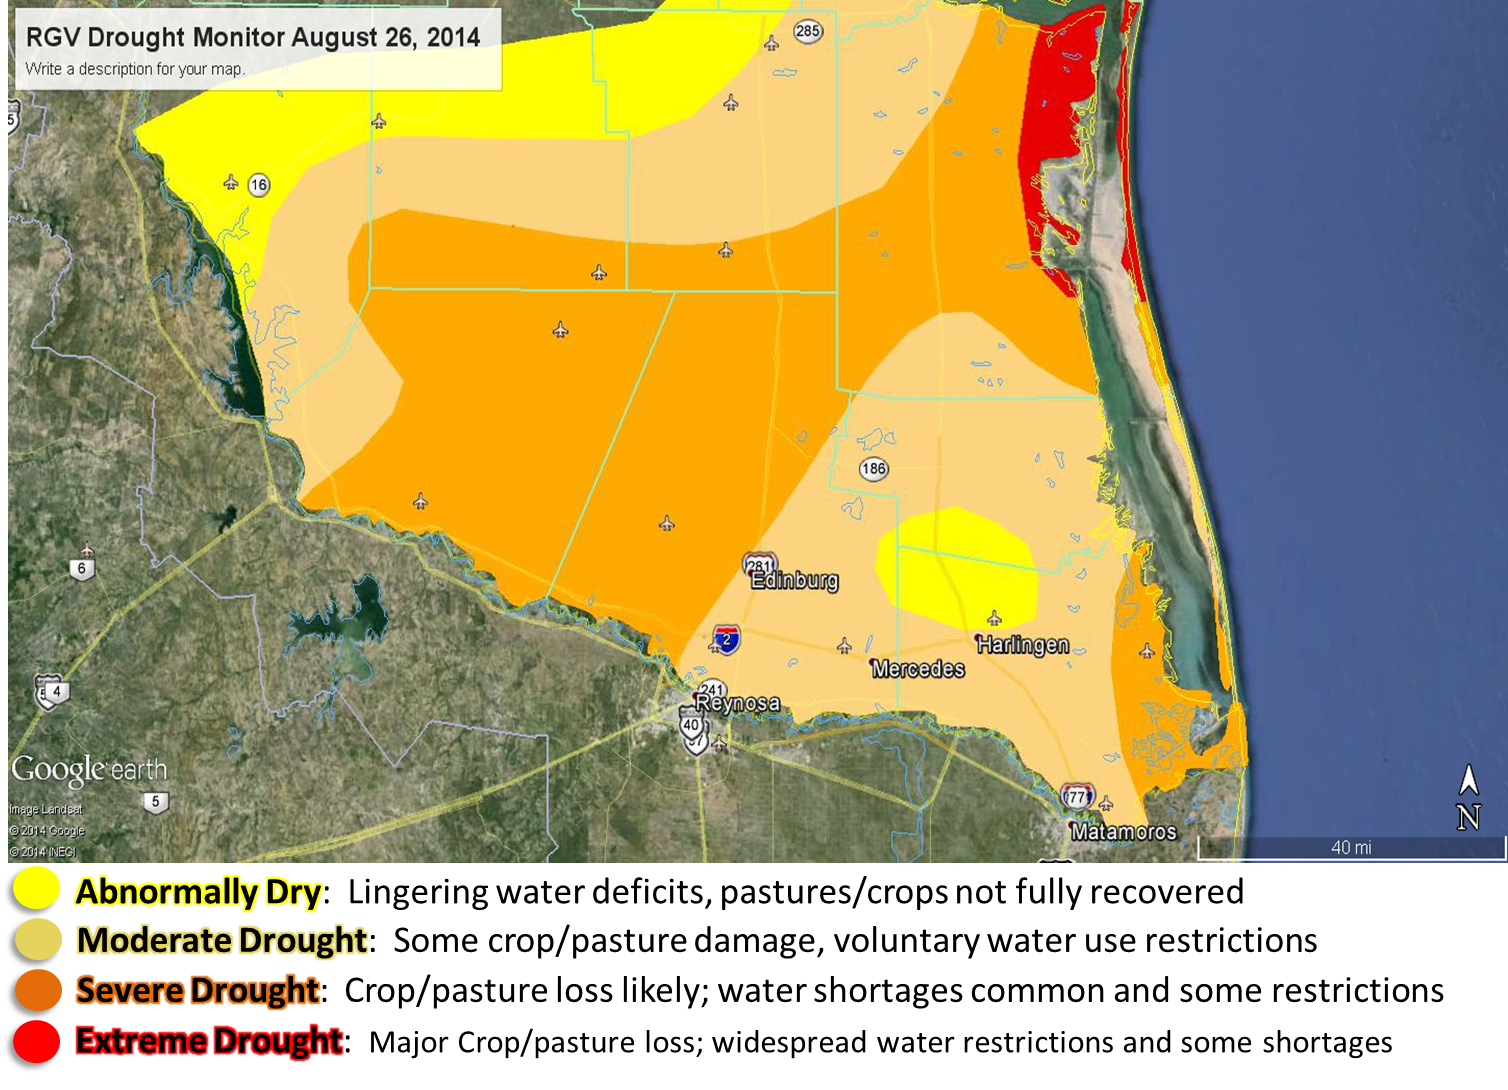
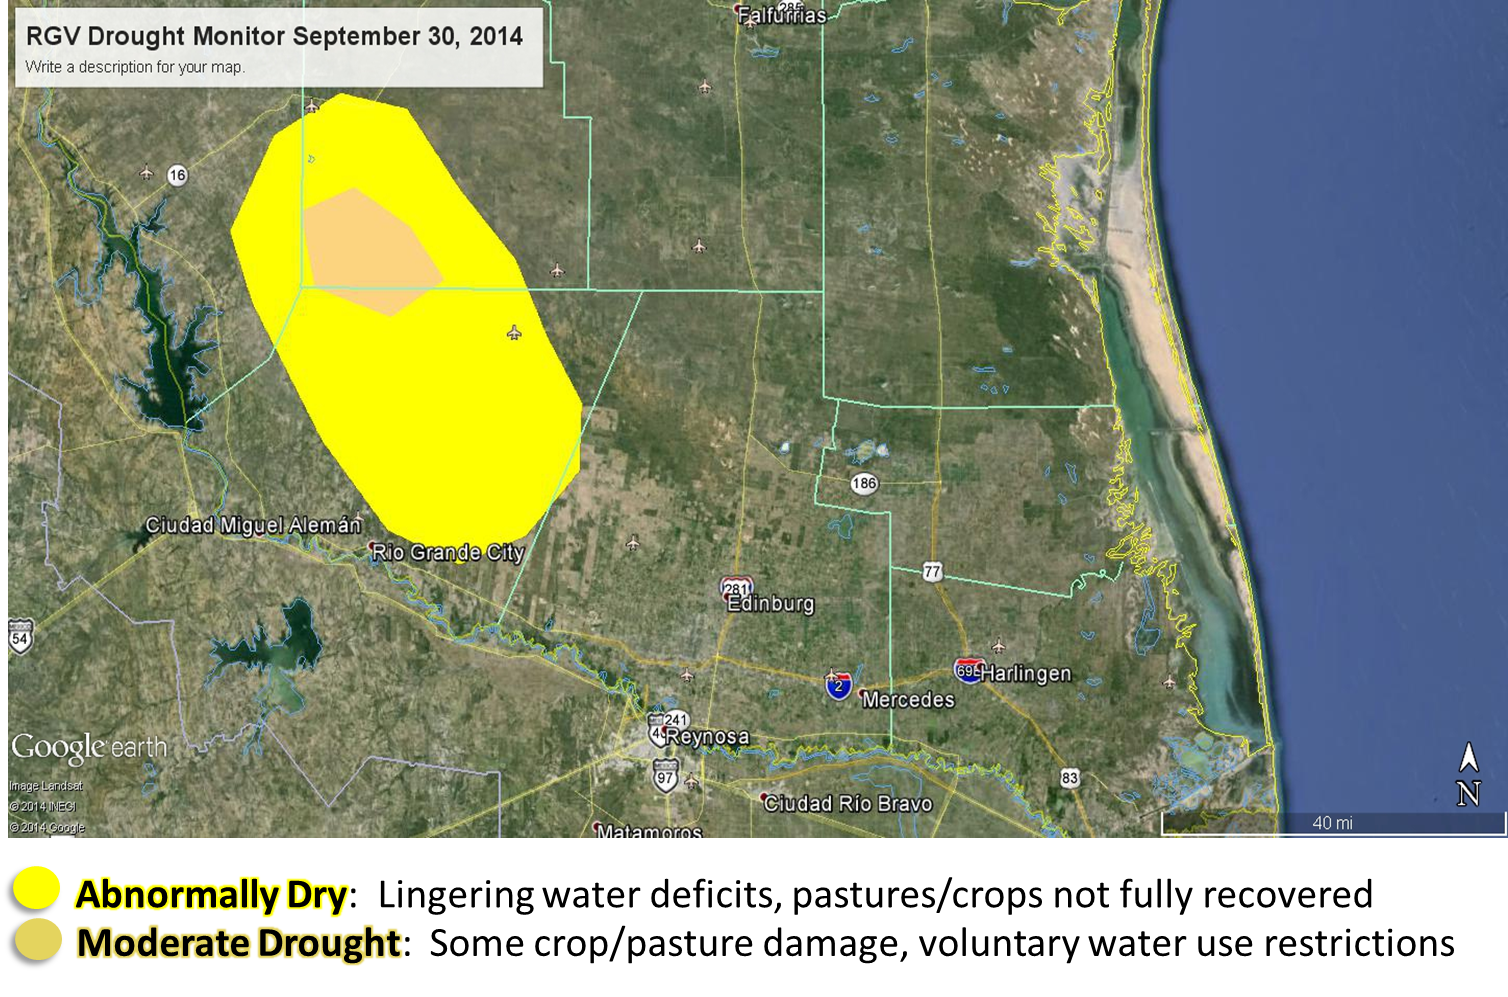
| Change in drought condition across the Rio Grande Valley from August 26th, before the late month rains arrived, to the end of September, after repeated soakings eliminated all but a portion of Jim Hogg County. Click for full size version. | |||||||||||||||||||||||||||||||||||||||||||||||||||||||||||||||||||||||||||||||||||||||||||||||||||||||||||||||||||||||||||||||||||||||||||||||||||||||||||||||||||||||||||||||||||||||||||||||||
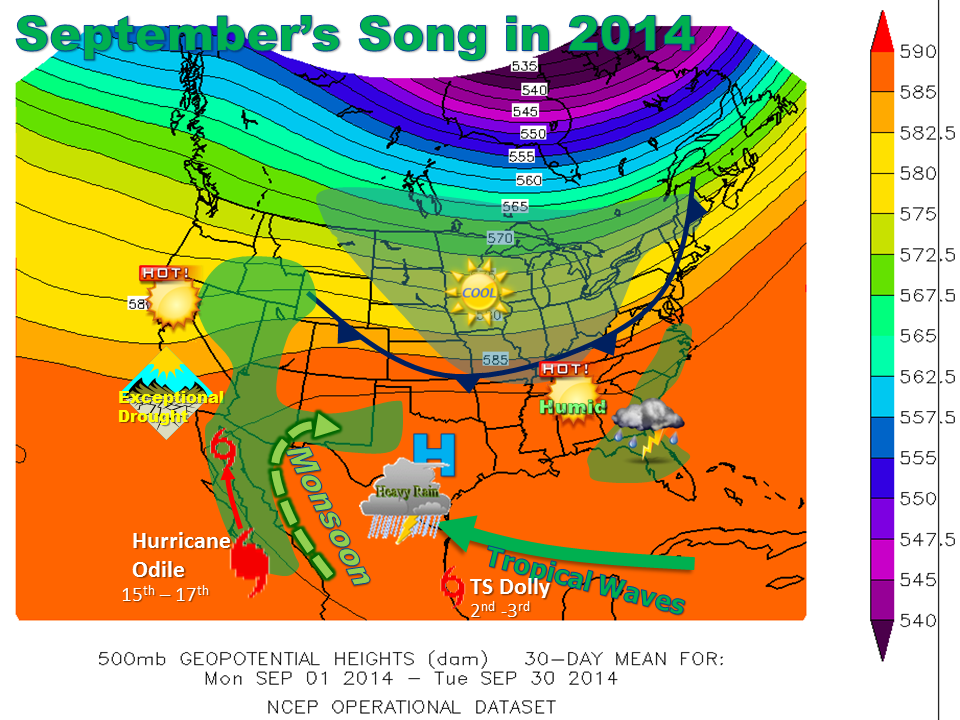 Steering flow at 500 mb for September 2014, with general weather trends overlaid. The Valley’s heavy rain was a result of persistent easterly flow underneath a broad high pressure system which stretched from central Texas to the southeast U.S. coast. Other big rains were driven by the North American Monsoon and the landfall of Hurricane Odile in Baja California across west Texas, southern New Mexico/north central Mexico, and Arizona. Early month cold fronts provided a taste of October one month early for the Midwest and northern Great Plains. |
|||||||||||||||||||||||||||||||||||||||||||||||||||||||||||||||||||||||||||||||||||||||||||||||||||||||||||||||||||||||||||||||||||||||||||||||||||||||||||||||||||||||||||||||||||||||||||||||||
**Missing several days in 2014, including rain events. Final totals are underrepresented. ***Harlingen/Valley Airport: Data available from 1952–1961 and 1998–present.
|
|||||||||||||||||||||||||||||||||||||||||||||||||||||||||||||||||||||||||||||||||||||||||||||||||||||||||||||||||||||||||||||||||||||||||||||||||||||||||||||||||||||||||||||||||||||||||||||||||

