Overview
|
A strong Colorado Low brought a significant storm to North Dakota during April 4th through 7th, 1997, resulting in the worst blizzard of the season for the state. Abnormally warm weather to start the month of April had much of North Dakota thinking spring had arrived, with high temperatures in the 60s and 70s the first few days of the month. A deep surface low moved out of Colorado and into the Northern Plains, with precipitation starting on Friday the 4th as rain in the eastern part of the state and freezing rain or sleet in the west. By Friday evening, the freezing rain and sleet had changed over to all snow in the west, moving into the central part of the state by Saturday afternoon and into eastern North Dakota later that night. Snow was accumulating at an average rate of 1.5 to 2 inches per hour, with 50 to 60 mph winds as well, leading to blizzard conditions. The blizzard ended in the west on the morning of Sunday the 6th, but continued into the evening across the east. The additional snow at Bismarck brought the season snowfall total to 101.4 inches, which is still the all-time seasonal snowfall record. Total damage was estimated to be $44.7 million, with 2 fatalities and 16 injuries. An estimated 100,000 head of cattle (10% of the state's herd) was lost, with a large percentage of that being calves and yearlings. Many power poles fell from the weight of the ice and snow combined with the strong winds. It's estimated that over 300 wooden poles had to be replaced, with one power company reporting about 100 steel towers damaged or destroyed with over 200 miles of transmission line down. An estimated 75,000 homes were without power for sometime over the weekend, with a few houses having to wait 4-5 days before power was fully restored. I-94, I-29, and all other major highways in the state were closed for the weekend. On Monday the 2nd, President Clinton declared North Dakota a disaster area for the 2nd time that winter, which freed up grants and made low interest loans possible. |
(North Dakota State Historical Society Collection 32228 Item #00002-00010) |
Photos & Video
 |
 |
 |
 |
(From the Bismarck Tribune) |
(From the Bismarck Tribune) |
(From the Bismarck Tribune) |
Snow drifts outside of Mandan's Lewis and Clark Elementary School. (From the Bismarck Tribune) |
 |
 |
 |
(From the Bismarck Tribune) |
(From the Bismarck Tribune) |
(From the Bismarck Tribune) |
Radar
Regional radar loop from the morning of April 4th through the afternoon of April 6th, 1997.

Satellite

Storm Reports
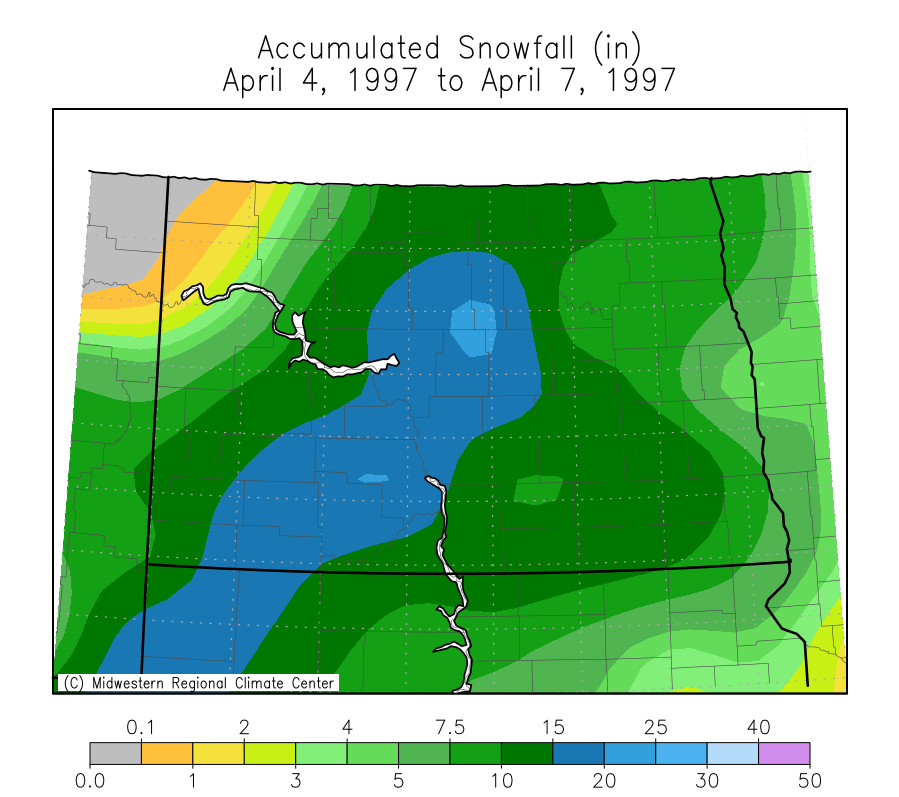
Snow totals from specific locations for April 4 - 7, 1997:
Jamestown - 16 inches
New Salem - 16 inches
Center - 17 inches
Bismarck - 17.5 inches
Dickinson - 18 inches
Washburn - 18 inches
Hebron - 20 inches
Mott - 22.5 inches
Bowman - 24 inches
Total snow accumulations from April 4 -7, 1997. Map from Midwestern Regional Climate Center.

Environment
Upper air analysis (courtesy of NOAA NWS NCEP). 4 panel figure includes 200mb heights/winds (upper left), 500mb heights/standardized anomalies (upper right), 850mb heights and temperatures with standardized anomalies (bottom left), and 1000mb heights and precipitable water with standardized anomalies (bottom right).
The upper air pattern leading up to the blizzard was characterized by split flow and a deep low over the far southwestern US, with a secondary trough over the northern Canadian provinces. Through the next few days, the northern low dropped south while the southern low pushed east, with a surface low pressure also developing. As the surface low progressed northeast through the central US, the two upper lows merged and helped deepen the surface low even further, with the entire system becoming stacked. By the 7th, both the surface low and upper low moved out of the region and into the Great Lakes area, ending wind and snow across North Dakota.
 |
 |
 |
 |
| Figure 1: Analysis from 00Z Friday, April 4th (evening of April 3rd). | Figure 2: Analysis from 00Z Saturday, April 5th (evening of April 4th). | Figure 3: Analysis from 00Z Sunday, April 6th (evening of April 5th). | Figure 4: Analysis from 00Z Monday, April 7th (evening of April 6th). |
Loop of reanalysis from 00Z on Thursday, April 3rd (Wednesday evening) through 00Z Tuesday, April 8th (Monday evening).

Surface analysis (courtesy of the NOAA Central Library)
 |
 |
 |
| Figure 4: Surface analysis from 7 AM EST on Friday, April 4th. | Figure 5: Surface analysis from 7 AM EST on Saturday, April 5th. | Figure 6: Surface analysis from 7 AM EST on Sunday, April 6th. |
 |
Media use of NWS Web News Stories is encouraged! Please acknowledge the NWS as the source of any news information accessed from this site. |
 |