What can you get from the NOWData web site?
Various data from several locations across parts of central New York and northeast Pennsylvania. Data varies
- Daily data for a month
- Daily almanac
- Monthly summarized data
- Calendar day summaries
- Daily/monthly normals
- Climatology for a day
- First/last dates
- Temperature graphs (interactive graph)
- Accumulation graphs (interactive graph)
To get to the site from the front page follow the arrows in the image below, or select the
1. Click on Climate and Past Weather
2. Click on Past Observed Weather.
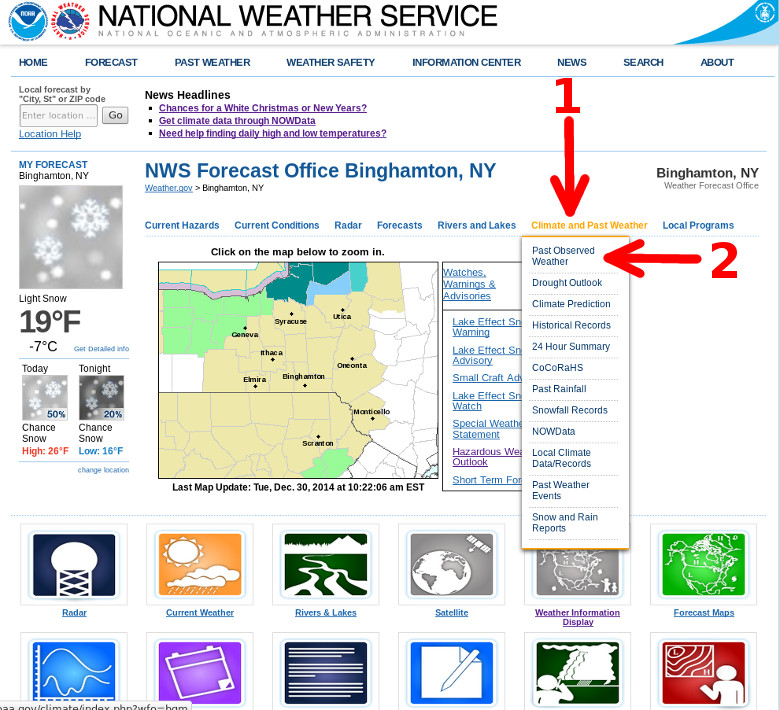
Then click on the blue NOWData tab at the top of the web page.

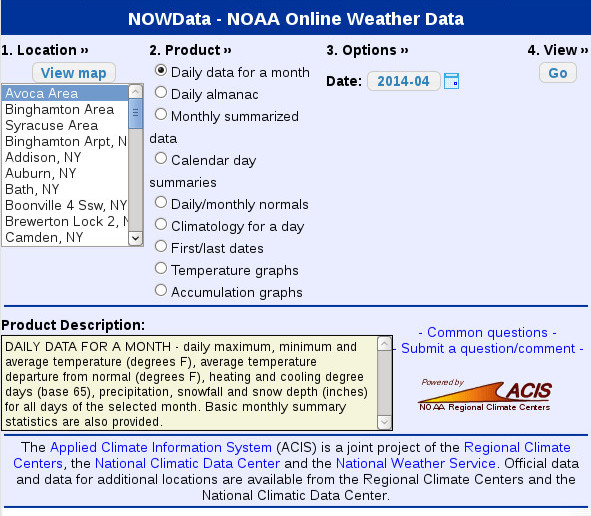
The main page of the page will show a 4 step process to view data.
- Location
- Product
- Options
- View (click on the Go button)
The blue tabs at the top of this have a few examples for extracting different types of data from the NOWData page.
Daily Data for a Month
Not every location in the central New York and northeast Pennsylvania has data. There are National Weather Service sites and cooperative observer sites on the NOWData page.
Each location has a Period Of Record or POR.The POR is how many years a site has been observing. This varies from site to site.
There are 3 main sites, they are:
- Binghamton Area - Binghamton, NY Airport 1951 to present.
- Syracuse Area - Syracuse, NY 1902 to present.
- Avoca Area - Scranton, PA 1901 to present.
Other sites listed are cooperative observers.
To get daily data for a past month and year follow these steps,
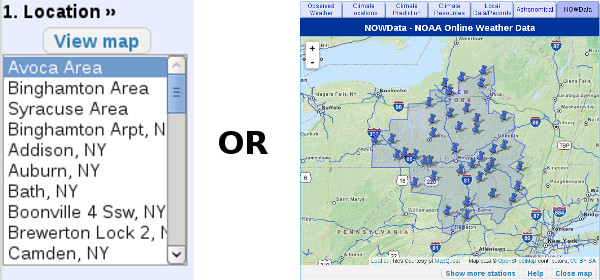
1. Under "1. Location" you can either select from the list or via a map. If map is chosen, then click on one of the push pin icons on the map.
2. Select Daily data for a month under the "2. Product".
3. Select the month and year under "3. Options".
4. Then click on the Go button under the "4. View".
After this a table will appear. The table will be embedded within request window and you may have to move the scroll bars in order to view the table. Or you can click on the Enlarge results button, as shown below with the arrow. This is pop out the table into a new window for easier viewing.
The final pop out window will look like this,
Monthly and Daily Normals/Averages
Follow these step to get the monthly or daily normals for a location.
The graphic below show the steps.
- Select the location either from the list or map under "1. Location".
- Under the "2. Product" select Daily/Monthly Normals.
- Click on either the Monthly or Daily button under "3 Options". More data is display when using the Daily selection.
- Then choose the Variable from the pull down menu. The menu has the following selections,
- Temperatures
- Precipitation
- Temperature/Precipitation
- Snowfall
- HDD base 65 (HDD = Heating Degree Days, see bottom of page)
- CDD base 65 (CDD = Cooling Degree Days, see bottom of page)
- GDD base 65 (GDD = Growing Degree Days, see bottom of page)
- Click on the Go button under "4. View".

The resulting display contains both a graph and a table. The graph is interactive. Moving the mouse pointer over the graph will show values on both the monthly and daily selections. Clicking on the Enlarge results will produce another browser window with the graph and table. However the graph is NOT interactive, but one can scroll down through the table of data.

Creating a table of Records
The following steps will produce a table of record values on the NOWData website.
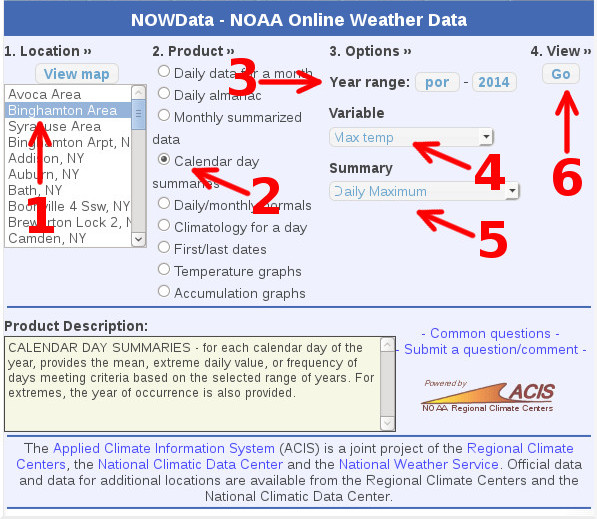
1. Under "1 Location" use the list or map to select a location.
2. Select Calendar Day Summaries under the "2 Product".
3. Under "3. Options" keep the Year Range from POR (Period Of Record) to the current year. Variables include the following,
- Max Temp - Maximum temperature in degrees Fahrenheit.
- Min Temp - Minimum temperature in degrees Fahrenheit.
- Avg Temp - Average temperature in degrees Fahrenheit.
- Precipitation - in inches.
- Snowfall - in inches.
- Snow Depth - in inches.
- HDD base 65 (HDD = Heating Degree Days, see bottom of page)
- CDD base 65 (CDD = Cooling Degree Days, see bottom of page)
- GDD base 65 (GDD = Growing Degree Days, see bottom of page)
Under Summary in "3. Option" some of these will be selected automatically depending on the variable, as shown above. Example, if the variable Max Temp is select, the Summary value of Daily Maximum will be automatically selected. Summary values include,
- Mean
- Daily Maximum
- Daily Minimum
- Number of Years
4. Click on the Go button under "4. View" to view the data.
The following graphic shows how to create a year's worth of record Maximum temperatures for the Binghamton, NY location.
The resulting table will look like this.
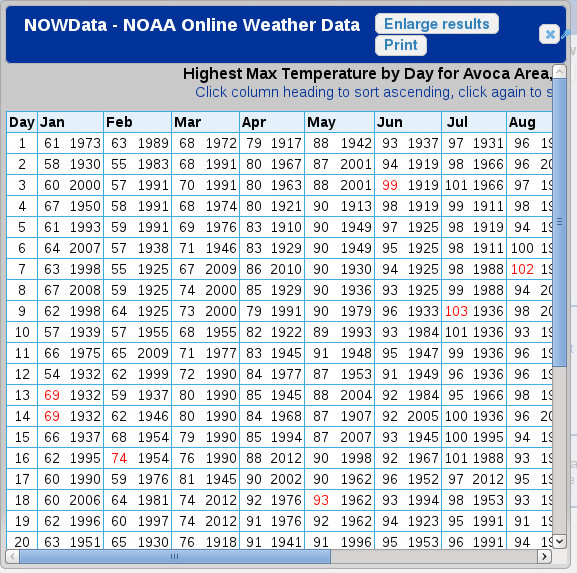
To make the table more visible, click on the Enlarge results button and new browser window containing the data will appear.

To find the seasonal totals for snowfall, try the following.

- Location: select a site.
- Products: select Monthly summarized data.
- Options: Select the Year Range.
- Options: Under Variable select snowfall.
- Options: Wnder Summary, the sum.
- Click on the Go button.
A small window will popup showing a table from seasonal values.

Note: Not all sites report rainfall and snowfall amounts.