LATEST NWS FIRE WEATHER ANNUAL OPERATING PLANS
|
Spot Forecast

Click on the icon
|
Fire Weather Dashboard

Click on the icon.
|
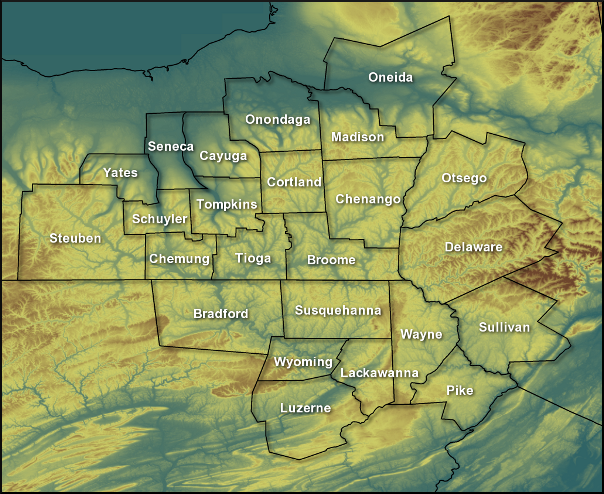
The National Weather Service office in Binghamton, New York is responsible for issuing Fire Weather Forecasts, Red Flag Warnings and Fire Weather Watches for parts of Central New York and Northeast Pennsylvania as shown in the image below.
A hourly weather graph forecast can be generated by going to the Hourly Graph website.
Guide to decoding the forecast below.
417

FNUS51 KBGM 311931

FWFBGM


Fire Weather Planning Forecast for Central NY/Northeast PA

National Weather Service Binghamton NY

330 PM EDT Fri Jul 31 2026


.SYNOPSIS...There are no fire weather concerns at this time.


NYZ210-010800-

Leatherstocking-

330 PM EDT Fri Jul 31 2026


                      Tonight      Sat          Sat Night    Sun


Cloud Cover           Mclear       Pcldy        Mcldy        Mcldy

Precip Type           None         None         Showers      Tstms

Chance Precip (%)     0            0            20           40

Chance of Thunder (%) 0            0            0            20

Temp (24h trend)      54 (-6)      84 (+4)      62           80

RH % (24h trend)      100 (0)      43 (0)       100          60

Wind 20ft/early(mph)  Lgt/Var      Lgt/Var      Lgt/Var      S 4-8

Wind 20ft/late(mph)   Lgt/Var      Lgt/Var      S 3-7        S 5-9 G18

Precip Amount         0.00         0.00         0.00         0.03

Precip Duration                                 1            2

Precip Begin                                    1 AM         Continuing

Precip End                                      Continuing   Continuing

Mixing Hgt(ft-agl/msl)             5770                      3800

Transport Wnd (mph)                S 10                      S 18

Vent Rate (kt-ft)                  76690                     95940

DSI                   2            2            2            2

Sunshine Hours                     6                         3

ADI early             35 Fair      33 Fair      35 Fair      58 Gen Good

ADI late              3 Very Poor  68 Good      9 Poor       70 Good

Max LVORI early       6            8            4            5

Max LVORI late        7            1            5            3


Remarks: ADI is Atmospheric Dispersion Index by Lavdas.

         LVORI is Low Visibility Occurrence Risk Index.


.FORECAST FOR DAYS 3 THROUGH 7...


.MONDAY...Mostly cloudy with showers likely and a chance of

thunderstorms. Lows in the lower 60s. Highs in the upper 70s.

Chance of precipitation 70 percent. Southeast winds around 5 mph.

.TUESDAY...Mostly cloudy. A chance of showers and a slight chance

of thunderstorms. Lows in the upper 50s. Highs in the upper 70s.

Chance of precipitation 50 percent. North winds around 5 mph.

.WEDNESDAY...Mostly cloudy. Showers likely and a slight chance of

thunderstorms. Lows in the lower 60s. Highs in the lower 80s.

Chance of precipitation 70 percent. East winds around 5 mph.

.THURSDAY...Mostly cloudy. A 50 percent chance of showers and

thunderstorms. Lows in the mid 60s. Highs in the lower 80s. South

winds around 5 mph.

.FRIDAY...Partly cloudy. A chance of showers and a slight chance

of thunderstorms. Lows in the lower 60s. Highs around 80. Chance

of precipitation 50 percent. Southwest winds around 5 mph.


$$


PAZ038-039-043-010800-

Bradford-Susquehanna-Wyoming-

Including the cities of Sayre, Towanda, Hallstead, Montrose,

and Tunkhannock

330 PM EDT Fri Jul 31 2026


                      Tonight      Sat          Sat Night    Sun


Cloud Cover           Pcldy        Pcldy        Mcldy        Mcldy

Precip Type           None         None         Showers      Showers

Chance Precip (%)     0            0            20           30

Chance of Thunder (%) 0            0            0            0

Temp (24h trend)      57 (-2)      84 (+3)      63           81

RH % (24h trend)      100 (0)      43 (0)       97           62

Wind 20ft/early(mph)  Lgt/Var      Lgt/Var      Lgt/Var      S 5-9 G19

Wind 20ft/late(mph)   Lgt/Var      S 3-7        S 4-8 G17    S 6-10 G19

Precip Amount         0.00         0.00         0.00         0.03

Precip Duration                                 1            2

Precip Begin                                    1 AM         Continuing

Precip End                                      Continuing   Continuing

Mixing Hgt(ft-agl/msl)             6560                      4490

Transport Wnd (mph)                S 14                      S 21

Vent Rate (kt-ft)                  85290                     98960

DSI                   2            2            2            2

Sunshine Hours                     6                         3

ADI early             36 Fair      55 Gen Good  61 Good      85 Good

ADI late              3 Very Poor  99 Good      8 Poor       93 Good

Max LVORI early       6            8            4            5

Max LVORI late        7            1            5            3


Remarks: ADI is Atmospheric Dispersion Index by Lavdas.

         LVORI is Low Visibility Occurrence Risk Index.


.FORECAST FOR DAYS 3 THROUGH 7...


.MONDAY...Mostly cloudy with showers likely and a chance of

thunderstorms. Lows in the mid 60s. Highs in the upper 70s.

Chance of precipitation 70 percent. Southeast winds around 5 mph.

.TUESDAY...Mostly cloudy. A 50 percent chance of showers and

thunderstorms. Lows in the lower 60s. Highs around 80. North

winds around 5 mph.

.WEDNESDAY...Mostly cloudy. Showers likely and a slight chance of

thunderstorms. Lows in the lower 60s. Highs in the lower 80s.

Chance of precipitation 60 percent. Southeast winds around 5 mph.

.THURSDAY...Mostly cloudy. A 50 percent chance of showers and

thunderstorms. Lows in the mid 60s. Highs in the lower 80s. South

winds around 5 mph.

.FRIDAY...Partly cloudy. A chance of showers and a slight chance

of thunderstorms. Lows in the lower 60s. Highs in the lower 80s.

Chance of precipitation 50 percent. Southwest winds around 5 mph.


$$


PAZ044-047-010800-

Lackawanna-Luzerne-

Including the cities of Scranton, Hazleton, and Wilkes-Barre

330 PM EDT Fri Jul 31 2026


                      Tonight      Sat          Sat Night    Sun


Cloud Cover           Mclear       Pcldy        Mcldy        Mcldy

Precip Type           None         None         None         Showers

Chance Precip (%)     0            0            0            20

Chance of Thunder (%) 0            0            0            0

Temp (24h trend)      59 (-1)      84 (+3)      63           82

RH % (24h trend)      97 (-3)      46 (+2)      97           60

Wind 20ft/early(mph)  Lgt/Var      Lgt/Var      Lgt/Var      S 4-8 G17

Wind 20ft/late(mph)   Lgt/Var      Lgt/Var      S 3-7        S 6-10 G19

Precip Amount         0.00         0.00         0.00         0.00

Precip Duration                                              1

Precip Begin                                                 8 AM

Precip End                                                   Continuing

Mixing Hgt(ft-agl/msl)             6040                      4820

Transport Wnd (mph)                S 12                      S 21

Vent Rate (kt-ft)                  69820                     100780

DSI                   2            2            2            2

Sunshine Hours                     6                         3

ADI early             30 Fair      56 Gen Good  49 Gen Good  76 Good

ADI late              3 Very Poor  84 Good      7 Poor       105 Very Good

Max LVORI early       6            7            4            5

Max LVORI late        6            1            5            3


Remarks: ADI is Atmospheric Dispersion Index by Lavdas.

         LVORI is Low Visibility Occurrence Risk Index.


.FORECAST FOR DAYS 3 THROUGH 7...


.MONDAY...Mostly cloudy with showers likely and a chance of

thunderstorms. Lows in the mid 60s. Highs in the upper 70s.

Chance of precipitation 70 percent. Southeast winds around 5 mph.

.TUESDAY...Mostly cloudy. A 50 percent chance of showers and

thunderstorms. Lows in the lower 60s. Highs in the upper 70s.

Light winds.

.WEDNESDAY...Mostly cloudy. Showers likely and a slight chance of

thunderstorms. Lows in the lower 60s. Highs around 80. Chance of

precipitation 60 percent. Southeast winds around 5 mph.

.THURSDAY...Mostly cloudy. A 50 percent chance of showers and

thunderstorms. Lows in the mid 60s. Highs in the lower 80s. South

winds around 5 mph.

.FRIDAY...Partly cloudy. A 50 percent chance of showers and

thunderstorms. Lows in the mid 60s. Highs in the lower 80s.

Southwest winds around 5 mph.


$$


PAZ040-048-072-010800-

Northern Wayne-Pike-Southern Wayne-

Including the cities of Damascus, Equinunk, Milford,

and Honesdale

330 PM EDT Fri Jul 31 2026


                      Tonight      Sat          Sat Night    Sun


Cloud Cover           Mclear       Pcldy        Mcldy        Mcldy

Precip Type           None         None         None         Showers

Chance Precip (%)     0            0            0            20

Chance of Thunder (%) 0            0            0            0

Temp (24h trend)      58 (-3)      82 (+2)      62           80

RH % (24h trend)      100 (0)      51 (0)       100          62

Wind 20ft/early(mph)  Lgt/Var      Lgt/Var      Lgt/Var      S 3-7

Wind 20ft/late(mph)   Lgt/Var      S 3-7        Lgt/Var      S 5-9 G17

Precip Amount         0.00         0.00         0.00         0.00

Precip Duration                                              0

Precip Begin                                                 2 PM

Precip End                                                   Continuing

Mixing Hgt(ft-agl/msl)             5900                      5250

Transport Wnd (mph)                S 10                      S 18

Vent Rate (kt-ft)                  58570                     95010

DSI                   2            2            2            2

Sunshine Hours                     7                         3

ADI early             36 Fair      51 Gen Good  43 Gen Good  56 Gen Good

ADI late              3 Very Poor  73 Good      6 Very Poor  99 Good

Max LVORI early       7            9            6            7

Max LVORI late        8            1            8            3


Remarks: ADI is Atmospheric Dispersion Index by Lavdas.

         LVORI is Low Visibility Occurrence Risk Index.


.FORECAST FOR DAYS 3 THROUGH 7...


.MONDAY...Mostly cloudy with showers likely and a chance of

thunderstorms. Lows in the mid 60s. Highs in the upper 70s.

Chance of precipitation 70 percent. Southeast winds around 5 mph.

.TUESDAY...Mostly cloudy. A 50 percent chance of showers and

thunderstorms. Lows in the lower 60s. Highs in the upper 70s.

North winds around 5 mph.

.WEDNESDAY...Mostly cloudy. Showers likely and a slight chance of

thunderstorms. Lows in the lower 60s. Highs in the upper 70s.

Chance of precipitation 70 percent. Southeast winds around 5 mph.

.THURSDAY...Mostly cloudy. A 50 percent chance of showers and

thunderstorms. Lows in the mid 60s. Highs in the lower 80s.

Southwest winds around 5 mph.

.FRIDAY...Partly cloudy. A 50 percent chance of showers and

thunderstorms. Lows in the mid 60s. Highs in the lower 80s.

Southwest winds around 5 mph.


$$
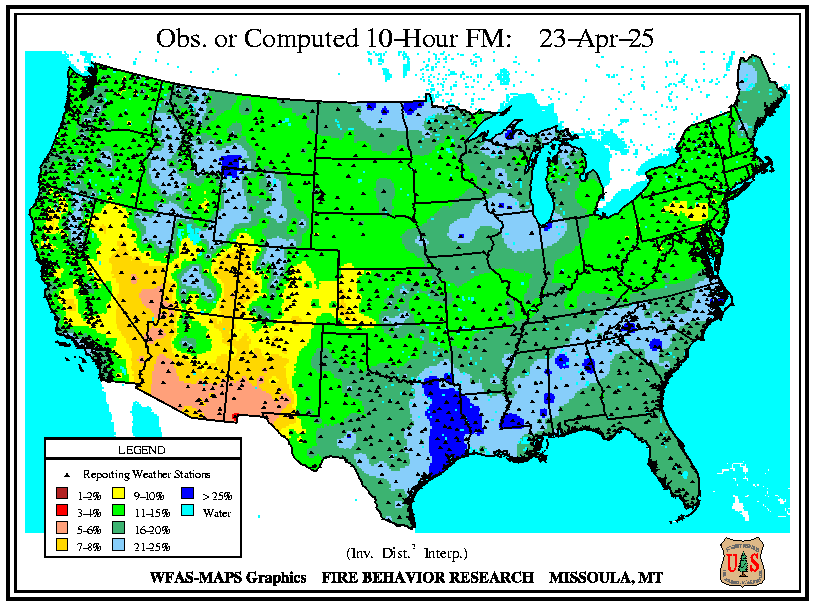
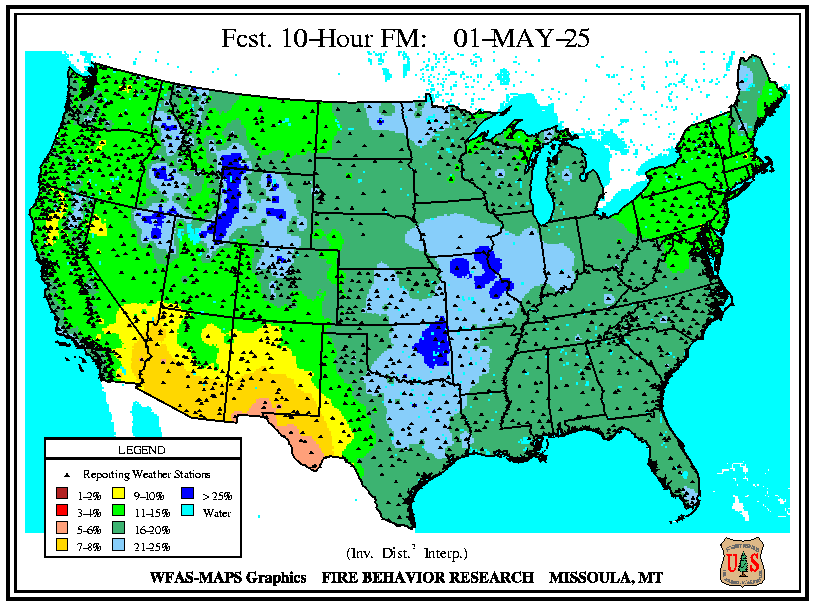
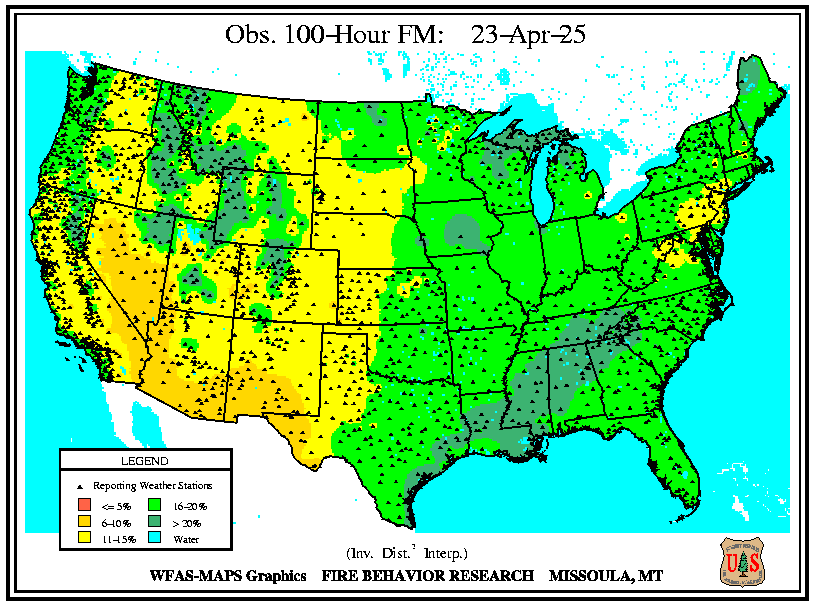
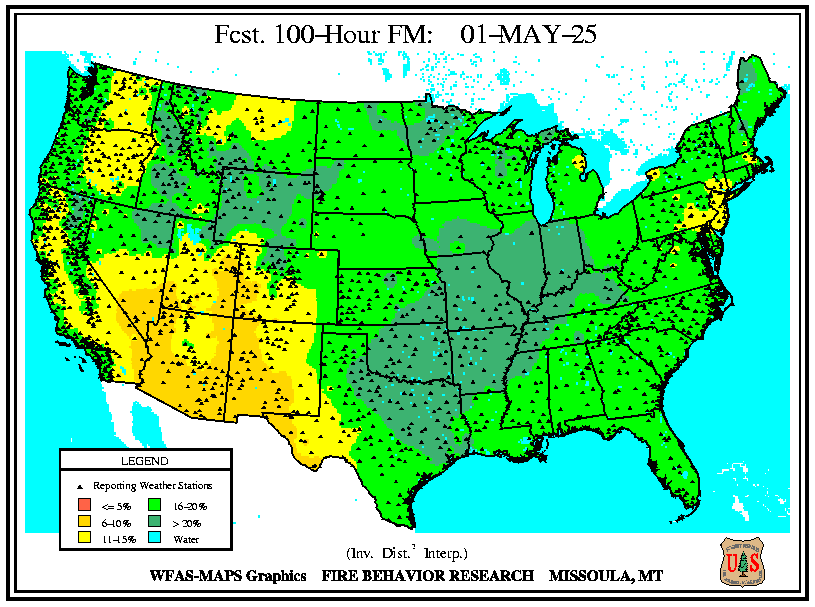
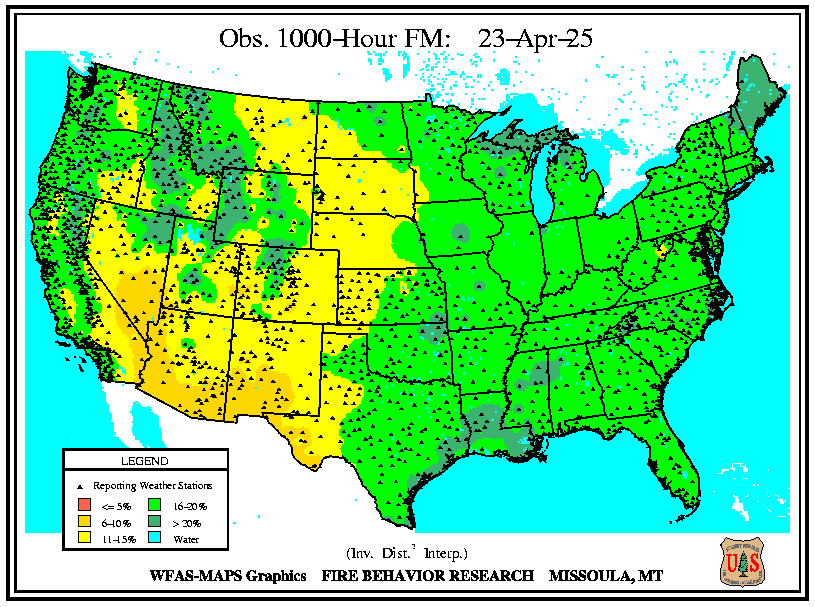
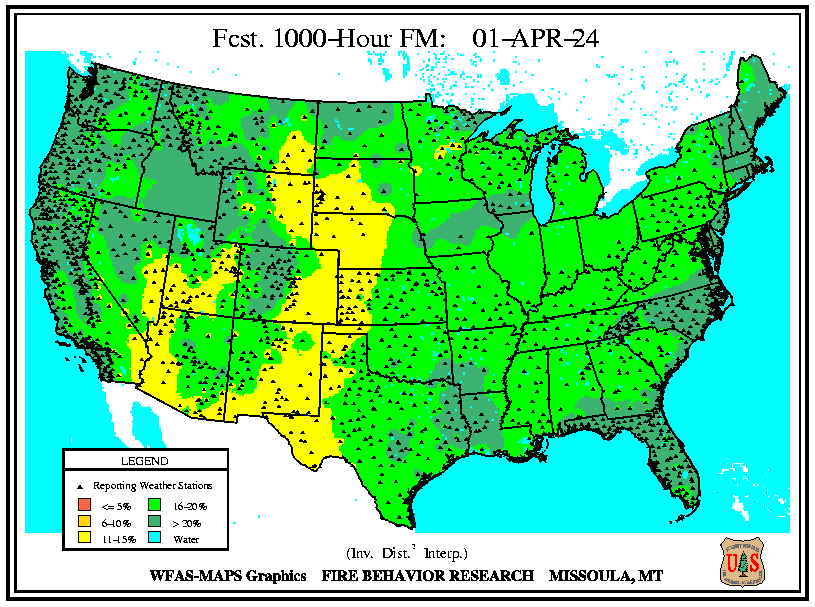
Fuel Conditions
Click on the images below to view them in higher detail. When doing so, each set of fuel moisture images will contain both the observed / computed and forecast. To view either, click left or right on images.