|
|
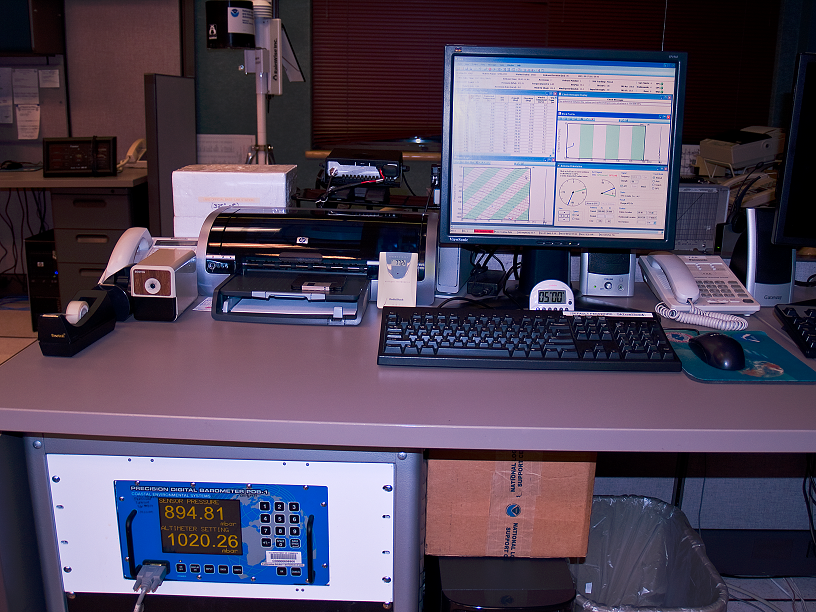
After the balloon has been launched, we need to go back inside to work the flight using the RWS software on the radiosonde workstation computer. The incoming data must be monitored closely to ensure the data is of good quality and has no inaccuracies. Minor corrections to the relative humidity, pressure, and temperature are typically applied in the first 30-45 seconds of the flight. A few minutes after launch, we can usually allow the software to automatically track the radiosonde using the GPS signal.
|
 |
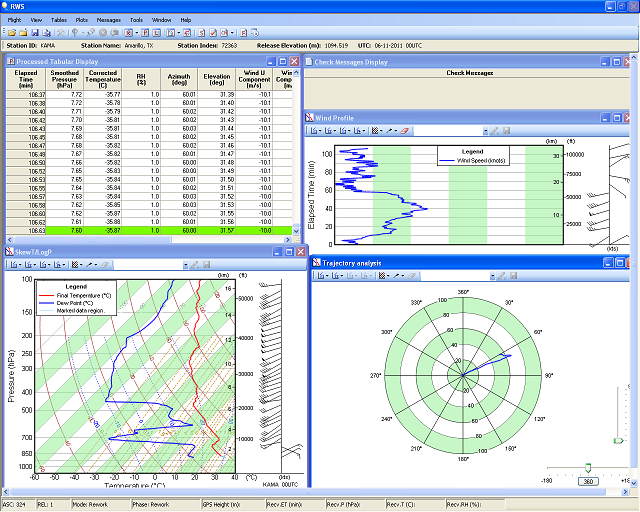
| While the radiosonde continues to ascend, it transmits a wide variety of data that is processed by the RWS software, including pressure, temperature, relative humidity, moisture, and wind speed and direction. Several graphical plots of the data are able to be analyzed, including wind speed and direction, trajectory, a Skew-T diagram, temperature, relative humidity, and pressure. |
 |
|
Between 20 and 25 minutes into the flight, the balloon reaches 400 mb (about 21,000 feet above ground level), and the software will prompt us to send the freezing level data to the National Centers for Environmental Prediction (NCEP). Here is what a coded freezing level message looks like:
UXUS44 KAMA 17000
FZLAMA
AMA 0000 RADAT 81154=
After about an hour into the flight, the balloon usually reaches 70 mb (about 60,000 feet above ground level), and the software will prompt us to transmit the mandatory and significant level data to NCEP. This data is considered the "meat and potatoes" of the balloon launch, and after it has been transmitted, it provides a snapshot of the vertical profile of the atmosphere near the location the balloon was launched. Below is an example of what a coded mandatory level message looks like:
USUS44 KAMA 180000
MANAMA
72363 TTAA 68001 72363 99894 35475 14009 00083 / / / / / / / / / /
92788 / / / / / / / / / / 85544 29073 14517 70223 12857 24005 50595
05767 35513 40767 15193 30511 30979 29988 29516 25106 40171
31025 20254 52165 29524 15434 67361 29521 10672 73959 30503
88121 75759 30023 77999 31313 58708 82302 51515 10164 00001
10194 16011 23508=
|
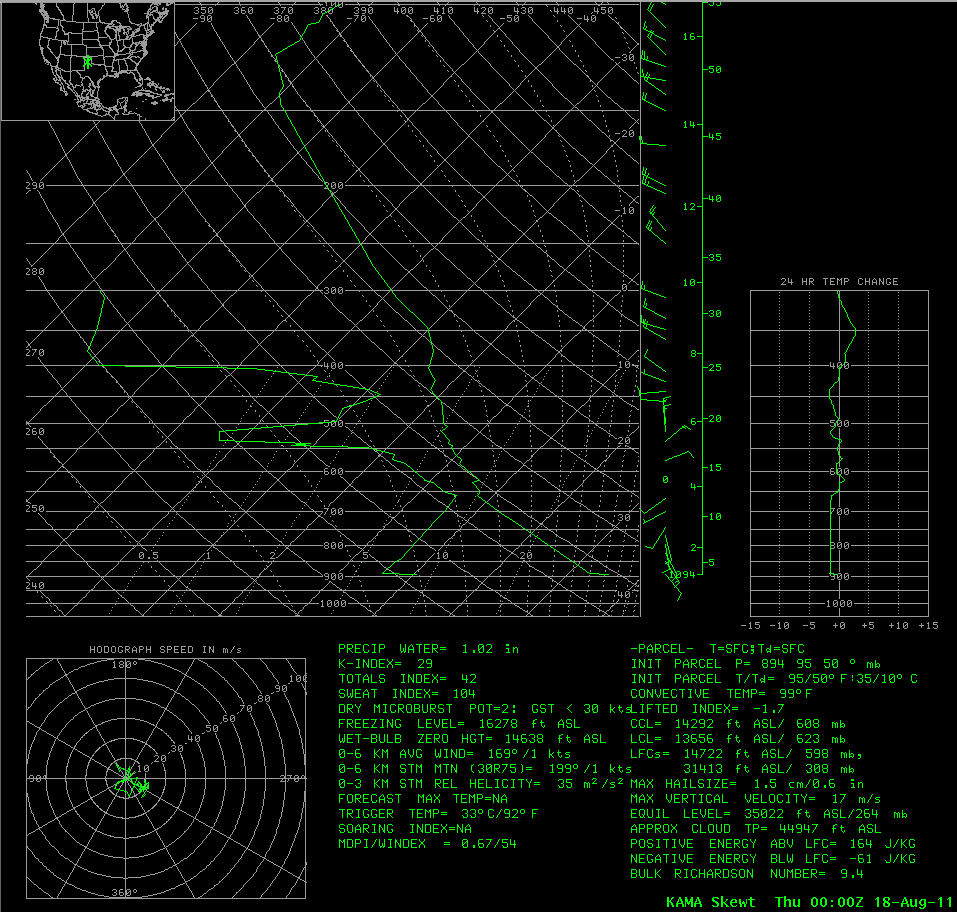
| The mandatory and significant level data can be graphically plotted on a diagram called a Skew-T/log-P chart that meteorologists are able to assess how temperature, moisture, and winds change in the atmosphere. This is an example of a Skew-T/log-P that is available to forecasters shortly after the mandatory and significant levels are transmitted. |
 |
|
About two hours after the balloon is launched, the balloon finally gets so large that it bursts. After the balloon bursts, the parachute opens and guides the radiosonde slowly back to Earth. Depending on the direction and strength of the winds in the atmosphere, the radiosonde may land as far away as western Oklahoma or southwestern Kansas! This typically only occurs between the late fall and early spring when the jet stream winds are strong. In the summer, winds aloft are weak, and it's not uncommon for the balloon to land 20 miles or less from our office. Every once in a while, the radiosonde lands in someone's back yard. In these instances, the radiosonde is equipped with a bag and instructions to mail it to Kansas City to be reconditioned. A couple of radiosondes a year might also be returned to us at the office.
After the balloon bursts, one final coded message is transmitted, the flight is archived and electronically sent to the National Climatic Database Center (NCDC). Finally, we need to record data on the flight, including the ascension rate from the surface to 400 mb, the ascension rate from 400 mb to the burst level, and the pressure and height in the atmosphere where the balloon burst. After we enter this data into a form online, the balloon flight is completed. Less than 12 hours later, the entire process will begin again.
|
|


