
Widespread, life-threatening considerable flash flooding is expected in south-central Texas through at least Friday. Catastrophic river flooding and rapid rises on small streams, arroyos, and typically dry washes are expected in the Texas Hill Country. Wildfire smoke is impacting air quality across much of the Great Lakes region into the Northeast U.S. with Air Quality Alerts in effect. Read More >
|
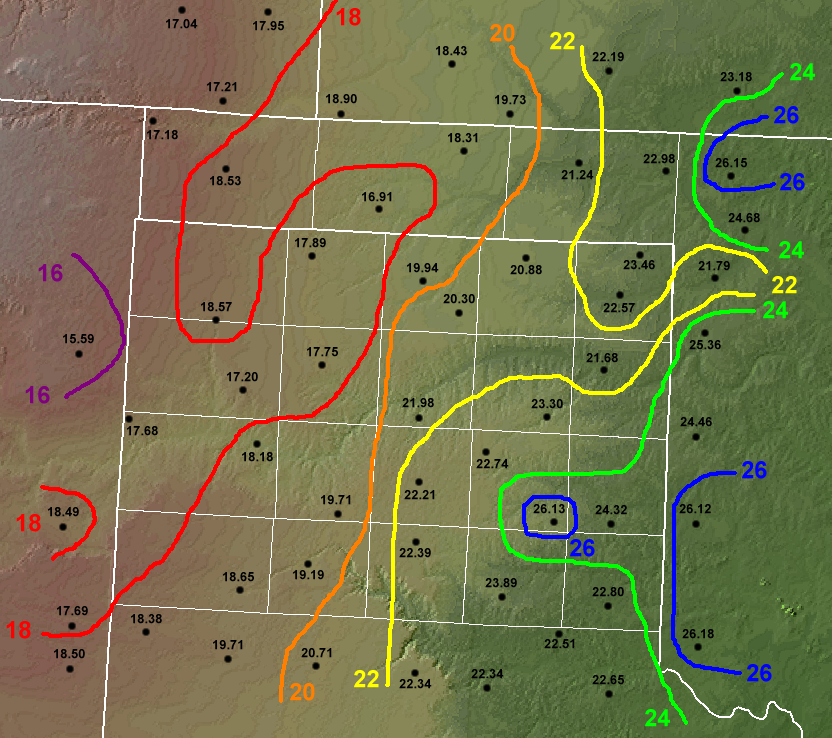
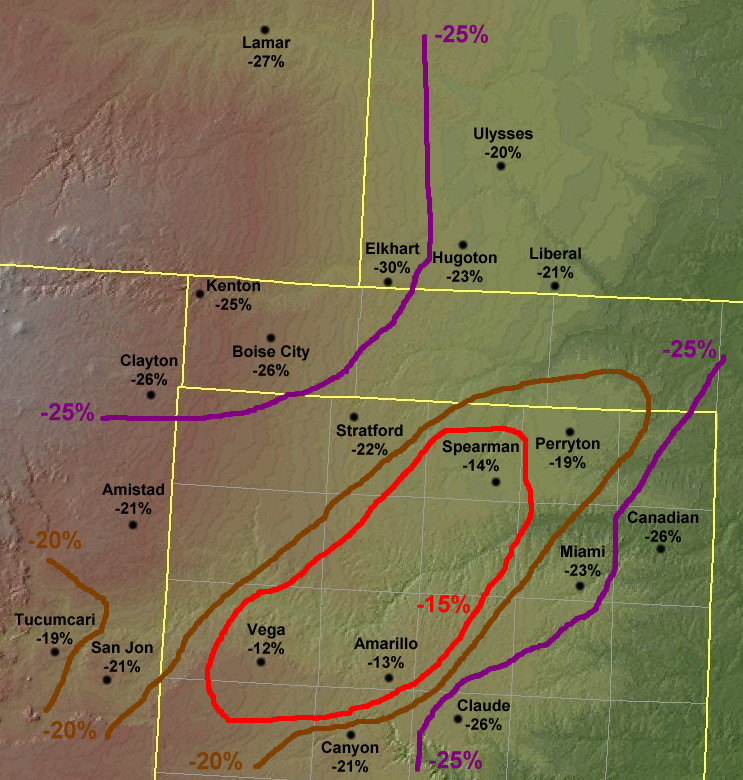
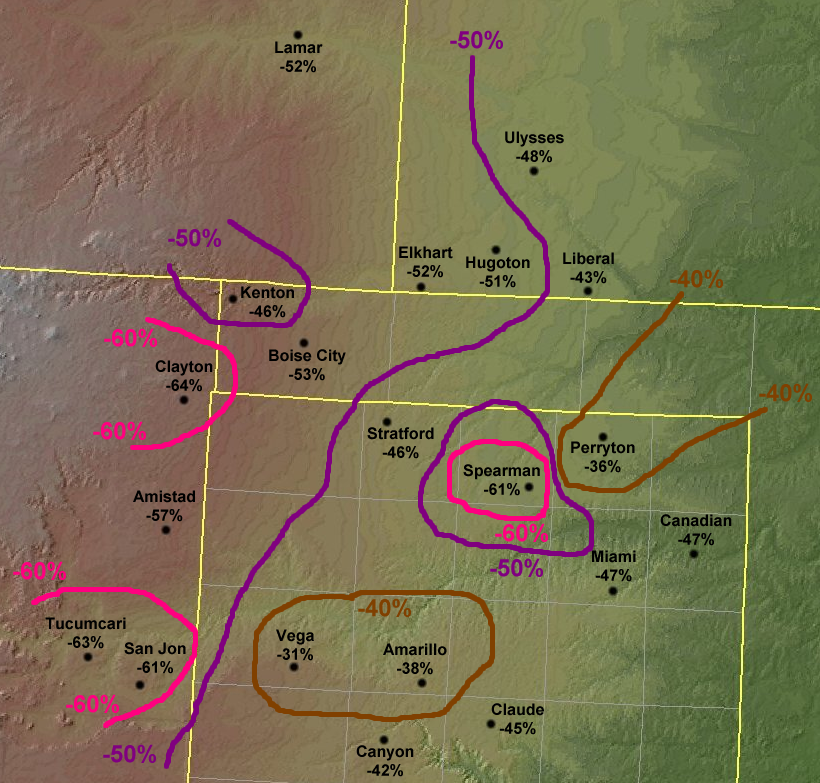
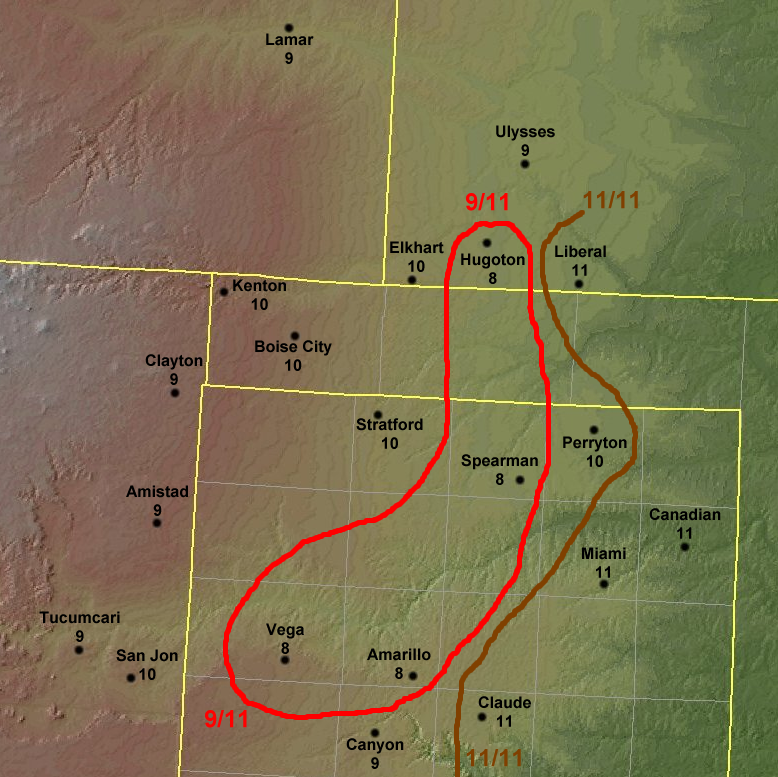
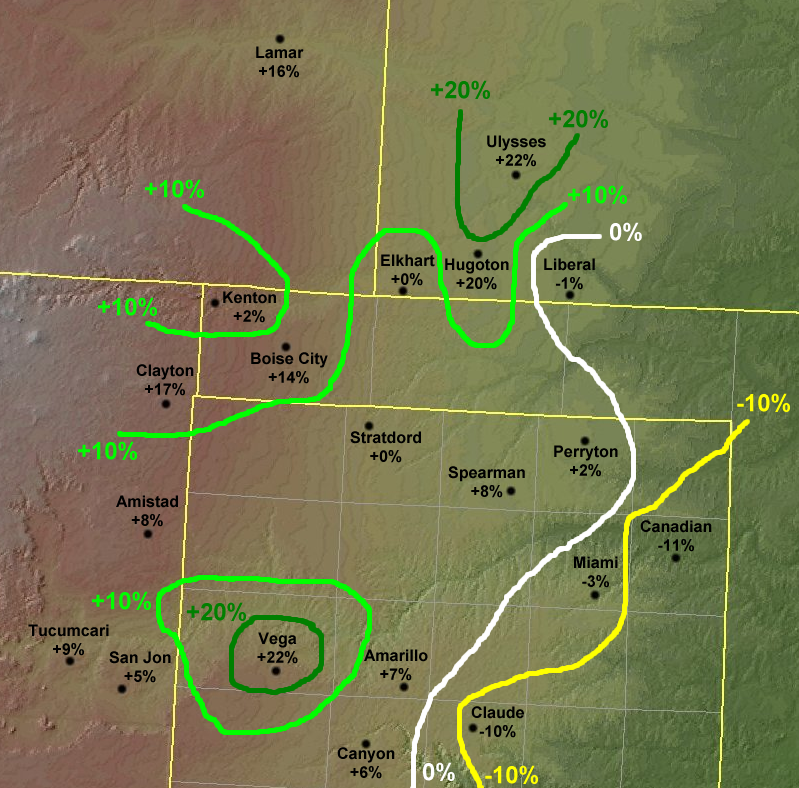
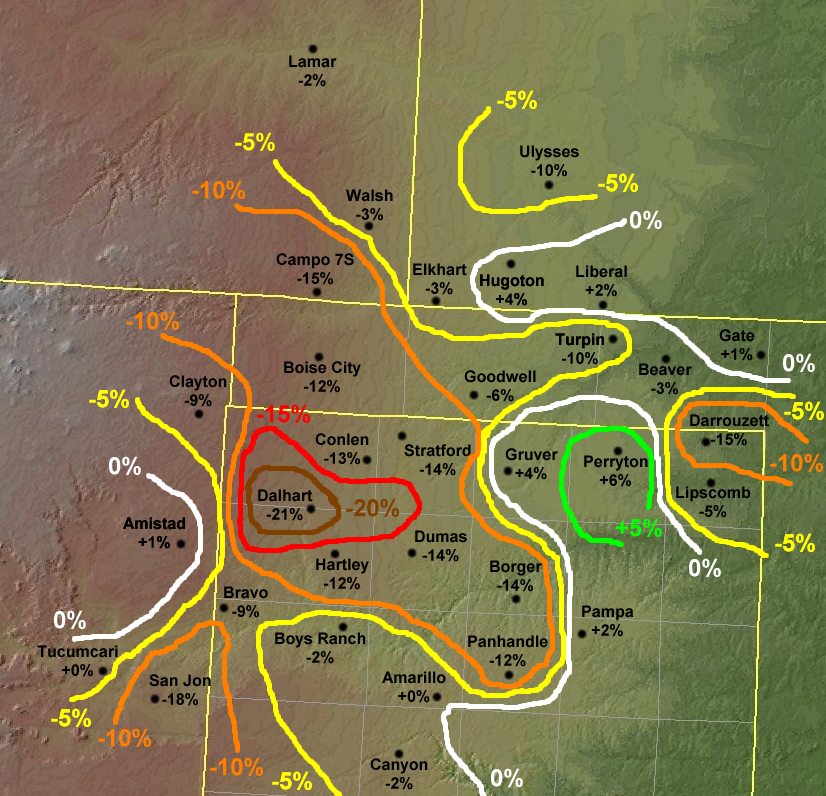
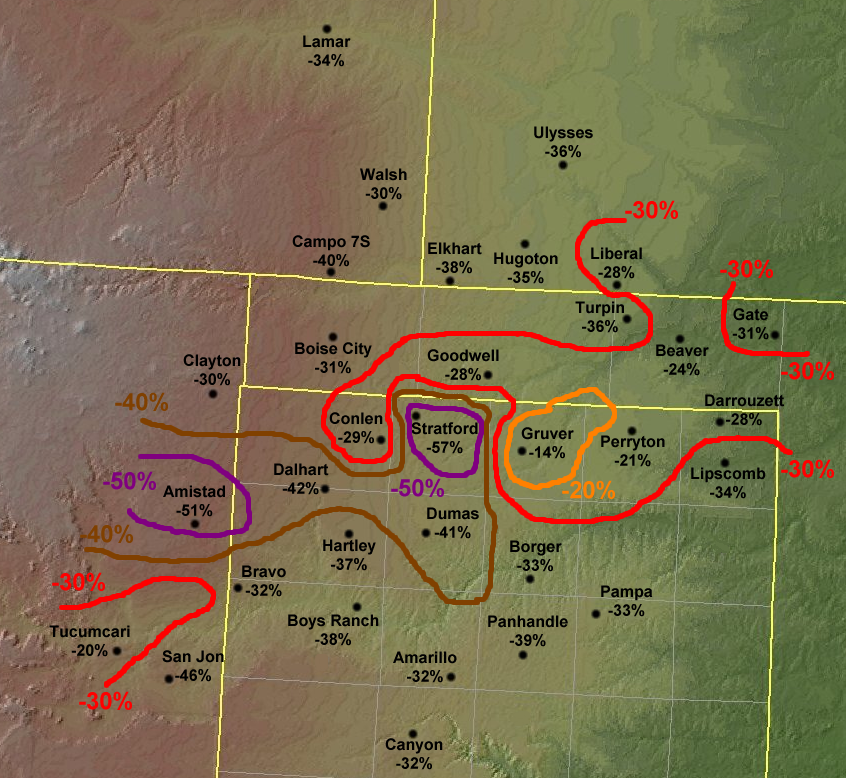
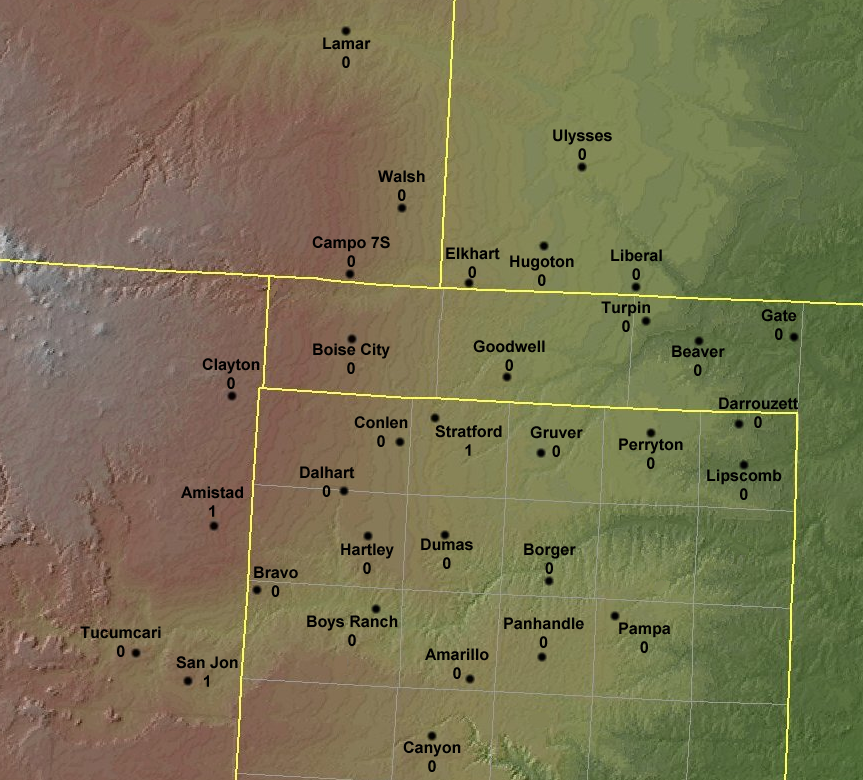
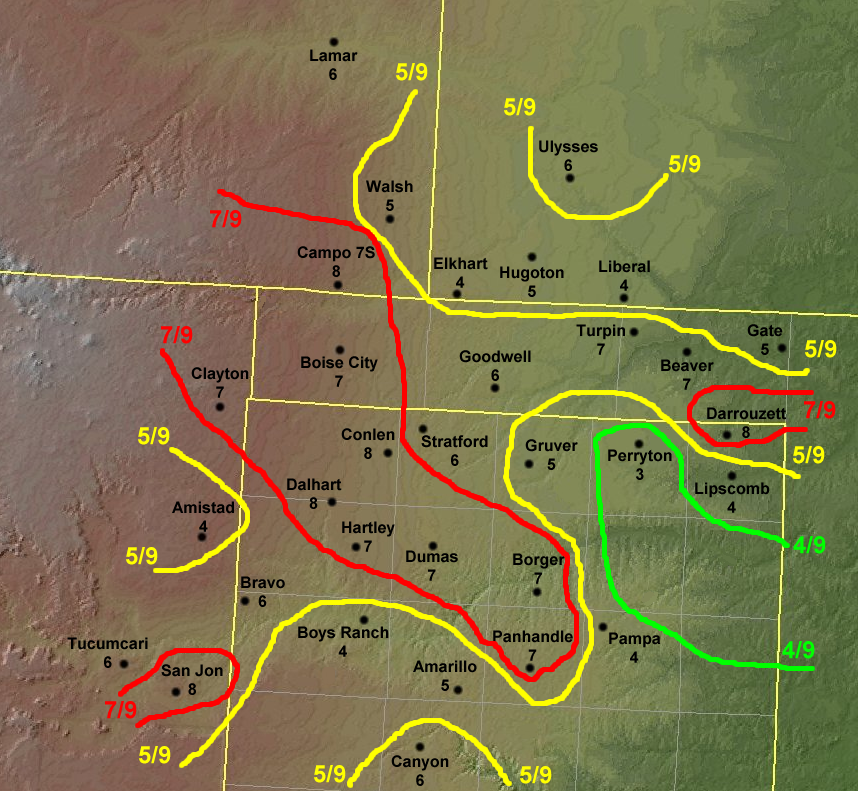
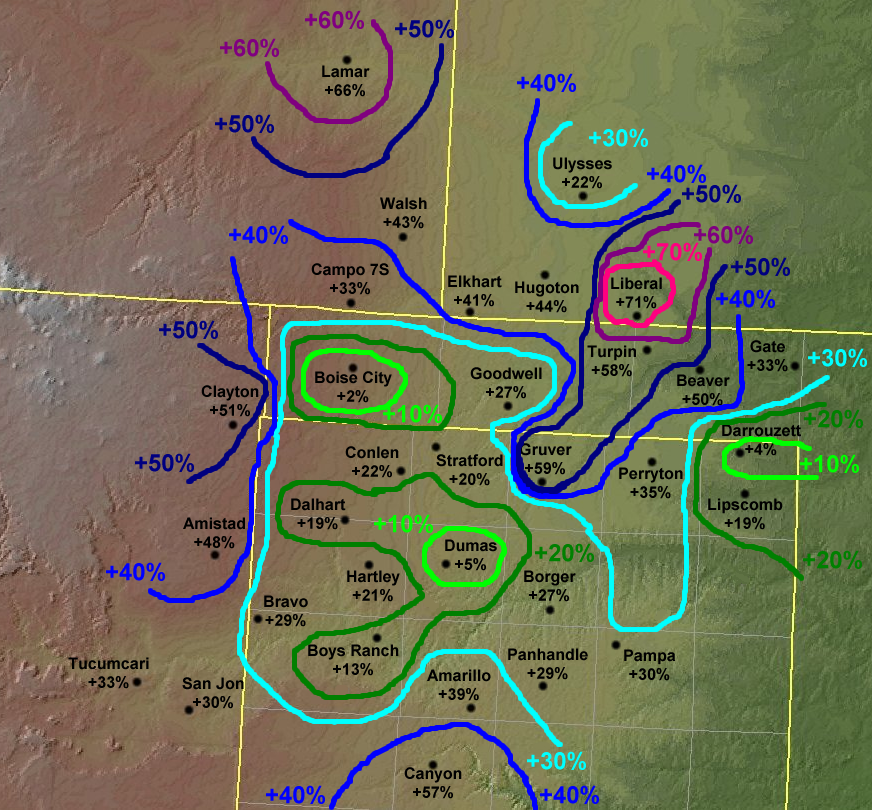
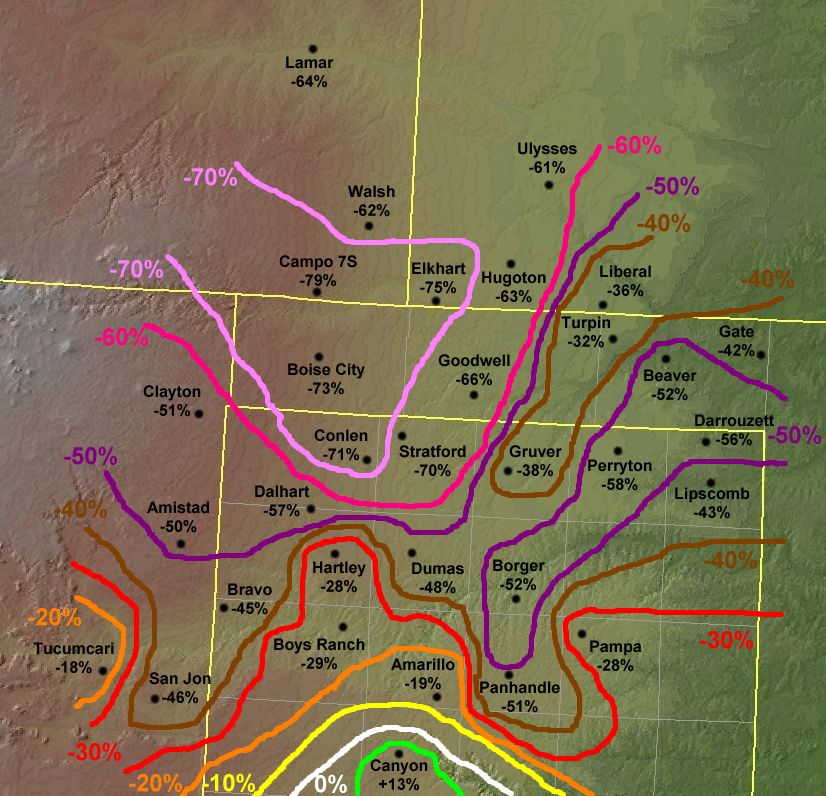
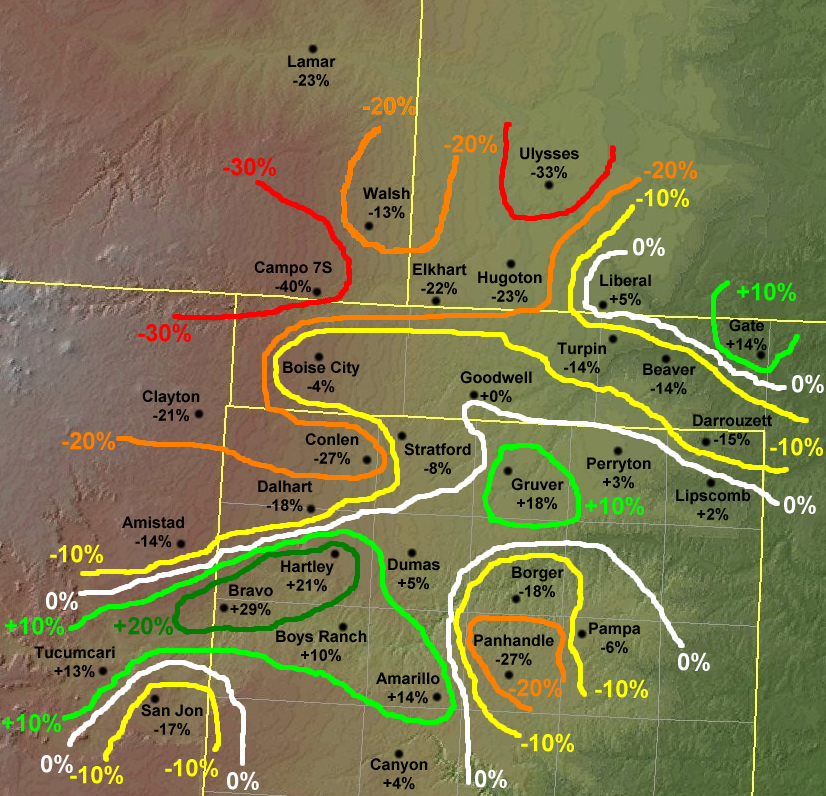
Comparison of Dust Bowl Regional Precipitation in 1930s vs. 2000s by Chris A. Kimble 1.0 Introduction With the early 2008 drought in the Western Oklahoma Panhandle and Northwestern Texas Panhandle, there have been many comparisons of the recent dry period with the infamous Dust Bowl of the 1930s. Although the year 2008 began extremely dry, with less than 2.5 inches of rain falling in the first half of the year in some places, the overall dryness has been much less intense and much less widespread than the Dust Bowl of the 1930s. The High Plains has a semi-arid climate which relies primarily on warm season thunderstorms to bring much-cherished rainfall to the land. Because thunderstorms are most often hit and miss, with one area getting heavy rain while areas nearby get nothing at all, one farmer’s field may be flooded while his neighbors a few miles away are left praying for rain for their parched crops and livestock. On the whole, though, most areas in the Southern High Plains average near or less than 20 inches of precipitation per year, with much of this falling in the spring and summer. Figure 1 is a map of average annual precipitation across the Texas and Oklahoma Panhandles. 2.0 Precipitation in the Dust Bowl Era (1930-1940) The 1930s was an exceptional time to be in the High Plains. The entire region, already a semi-arid climate to begin with, endured extreme drought for almost a decade. 2.1 Extent Over the 11-year span from 1930-1940, a large part of the region saw 15% to 25% less precipitation than normal. This is very significant to see such a large deficit over such a long period of time. This translates to 50 to 60 inches of much needed moisture which never arrived that decade. For an area which only averages less than 20 inches of precipitation a year, deficits like this can make the region resemble a desert. Deficits like this are the equivalent of missing three entire years of expected precipitation in one decade. Figure 2 is a map of the precipitation departures from normal in terms of a percentage of normal (total precipitation divided by normal precipitation) for the Dust Bowl region for 1930 to 1940. 2.2 Intensity One of the most impressive things about the Dust Bowl of the 1930s is not only how long the drought lasted, but how intensely dry some of the years were. Some years only had less than half of the normal annual precipitation. Figure 3 is a map of the departure from normal in terms of a percentage of normal (total precipitation divided by normal precipitation) for the single driest year in the 1930 to 1940 time period (for example, the driest year at Boise City was 1934 which was 53% below normal). 2.3 Desertification Another measure of the intense dryness of this period is how many years were not only dry, but extremely dry. The classic definition of a desert is an area which receives less than 10 inches of rain per year. During the 1930s there were large parts of the High Plains which saw entire years go by with less than 10 inches of precipitation. They essentially became a desert. In fact, in many cases there were several years in a row with less than 10 inches of precipitation. Figure 4 is a map of the number of years with less than 10 inches of precipitation during the 1930 to 1940 time period. 2.4 Length Even during the longest droughts, there are some periods of increased moisture. So even though the 1930s as a whole were very dry, it would be reasonable to expect at least a few wet years mixed in with all the dry ones. But in the 30s, almost every year had less precipitation than normal. Figure 5 is a map of the total number of below normal years in this time period. Notice that some areas were below normal all 11 years. 2.5 Breaks As mentioned previously, it would be reasonable to expect a few wet years mixed in with all the dry years of the 1930s. But even the wet years were not very wet, so the region was not able to take advantage of some very wet periods to recuperate from all of the extremely dry years. The dry years were intensely dry, but the wet years were not nearly as intensely wet. Figure 6 is a map of the departure from normal in terms of a percentage of normal (total precipitation divided by normal precipitation) for the single wettest year in the 1930 to 1940 time period (for example, the wettest year at Boise City was 1930 which was 14% above normal). 2.6 Summary As can be seen by the data presented above, the dry years of the 1930s were extremely dry, and there were no extremely wet years to help the land recuperate. With this very dry pattern lasting for a decade or more, the 1930s proved to be the most difficult time to be a farmer in the High Plains! 3.0 Precipitation in the 2000s Since the year 2000, parts of the region have once again turned to a drier than normal pattern. And with 2008 starting out extremely dry in some places, many people have begun to wonder if the area is returning to another “Dust Bowl” climatological period. And although it is very hard to predict the future precipitation over the span of several years, a comparison of the current dry period with the 1930s dry period can be made. 3.1 Extent The dryness this decade has not been as widespread as in the 30s. Large parts of the region have seen 10% to 20% less precipitation than normal, but some have actually had a surplus. Figure 7 is a map of the precipitation departures from normal in terms of a percentage of normal for 2000 to 2008. 3.2 Intensity The driest years of this current decade have also not been nearly as intensely dry as the dry years of the 30s. The driest years this decade were generally 30 to 50% below normal. Figure 8 is a map of the departure from normal in terms of a percentage of normal (total precipitation divided by normal precipitation) for the single driest year in the 2000 to 2008 time period. 3.3 Desertification Another measure which shows how this decade has not been as intensely dry as the 1930s is to look at how many years were not only dry, but extremely dry. Very few locations have seen less than 10 inches of precipitation in a single year this decade, and no location has experienced these desert-like conditions more than once. Figure 9 is a map of the number of years with less than 10 inches of precipitation during the 2000 to 2008 time period. 3.4 Length Another factor to consider is how many years this decade which have seen below normal precipitation. The comparison here once again shows that not as many years were dry this decade as were in the 1930s, thus the cumulative effect of the dry period has not been as intense. Figure 10 is a map of the total number of below normal years from 2000 to 2008. Notice that no areas have been below normal all 9 years this decade. 3.5 Breaks The wet years this decade have also been more significantly wet, helping to reduce the cumulative effect of the long term dryness. There have only been a few areas which have not had a very wet year, and most areas have had extremely wet years which more than compensate for the driest year this decade. Figure 11 is a map of the departure from normal in terms of a percentage of normal for the single wettest year in the 2000 to 2008 time period. 3.6 Summary As can be seen in the various images presented above, the 2000s have been drier than normal in some locations, but not nearly as dry as the 1930s. The extent of the dryness has also not been as widespread as it was in the Dust Bowl. 4.0 Precipitation in 2008 4.1 Early Drought The year 2008 started off extremely dry in some areas, prompting some to fear a return to the Dust Bowl era. Normally the winter months are very dry, with thunderstorms and significant precipitation returning in March or April and lasting through summer. But in 2008 the spring rains were late to arrive in some areas. Significant rainfall from thunderstorms didn’t occur until mid-June or July. From January 1-June 30, 2008 a large part of the region was 40% or more below normal for the period. Figure 12 is a map of the precipitation departures from normal for the first half of 2008 (January1 - June 30). 4.2 Late Rains Late in the summer the region finally returned to a wet weather pattern. The remnants of three tropical systems (2 Atlantic and 1 Pacific) impacted the area from July through October. Hurricane Dolly brought rains to the area in late July. An unusually large upper level storm system brought cold temperatures and flooding rains to large parts of the area in mid-August, and another system brought heavy rains in mid-October. These systems helped alleviate the effects of the extremely dry start to the year and brought several areas up to above normal for the year as a whole. Figure 13 is a map of the precipitation departures from normal for the entire year (January 1 - December 31, 2008): 5.0 Conclusions To summarize, the 2000s have been dry for parts of the High Plains, most notably the Northwestern Texas Panhandle and the Western Oklahoma Panhandle (along with adjacent areas of Northeast New Mexico). The cumulative effect of the prolonged dryness has impacted not only crops and grasslands, but also area lakes and reservoirs. Because some of the driest areas happen to be in the Canadian River watershed, water levels at Lake Meredith have been dropping for several years. Other factors like water usage from cities also affect lake levels, but the prolonged dryness has been a significant factor for the declining lake levels since 1999. Figure 14 shows the declining water levels at Lake Meredith. The year 2008 started off extremely dry particularly in the Northwestern Texas Panhandle, the Western Oklahoma Panhandle, and Northeast New Mexico. The first half of the year was as much as 70-80% below normal in some locations. But in large part, the rains returned late in the summer allowing the year as a whole to be not as extremely dry even in the worst affected regions. One last thing to note is that this region is heavily reliant on warm season thunderstorms for the majority of the annual precipitation (87% of precipitation falls from March thru October in Amarillo). Because of this, the variability in precipitation can be extreme not just from location to location but also from year to year. So one observation point may be very dry, while almost every other location nearby may be wet. But over long periods of time, this variability eventually levels out. What was impressive about the 1930s was that such a widespread area saw very low precipitation amounts for an extended period of time. Although some areas were drier than others, the whole region was uniformly very dry, as if the thunderstorms never came. In the 2000s only a small area has been persistently dry, and the variability noticed in the precipitation departures from normal map (the blotchy nature of the contours) resembles much more what would be expected for an area which receives so much precipitation from localized thunderstorms. |

