| Drought Continues to Impact the Texas and Oklahoma Panhandles |
| If you live in the Texas or Oklahoma Panhandles or follow the weather in this area, it's obviously been extremely dry this year. So, exactly how dry has it been? As of May 30, the climate sites at Amarillo, Borger, and Dalhart are all experiencing the driest start to a year on record (Table 1). A few communities have been fortunate to receive some badly needed rains the last few weeks, but overall, precipitation has been quite scarce since the late fall. Even when the area has experienced precipitation, amounts have generally been light. In fact, the last time at least one tenth of an inch of precipitation was recorded during a 24-hour period at Amarillo was February 8 (0.10") when the city was affected by a winter storm. Dalhart and Borger have seen at least one tenth of an inch of precipitation somewhat recently, but even those precipitation events have been isolated. Borger picked up 0.31" of rain thanks to thunderstorms on May 11, and Dalhart received 0.10" on April 24. To find the last time that at least one quarter of an inch of precipitation was measured in a 24-hour period at Amarillo and Dalhart, you've got to go back to the fall of 2010. 0.65" was recorded at Dalhart on October 21 and 1.28" was recorded at Amarillo on November 12. |
| Amarillo | Borger | Dalhart |
| 0.68" in 2011 | 1.25" in 2011 | 0.61" in 2011 |
| 1.35" in 1996 | 1.34" in 1996 | 1.87" in 2008 |
| 2.12" in 1966 | 2.17" in 1953 | 2.01" in 1950 |
| 2.67" in 1950 | 2.81" in 1966 | 2.17" in 2002 |
| 2.82" in 2003 | 3.18" in 1972 | 2.19" in 1953 |
| 2.87" in 1894 | 3.39" in 1970 | 2.21" in 1966 |
| It is interesting to note that of the top 5 driest starts to a year between January 1 and May 30 at Amarillo, none ended in the top 5 driest years on record (Table 2). At Dalhart, only 2002 had the distinction of being in the top 5 for driest starts to a year and in the top 5 for driest years on record. At Borger, 1970 and 1953 share the distinction of being in the top 5 for driest starts to a year and in the top 5 for driest years on record. |
| Amarillo (since 1892) | Borger (since 1890) | Dalhart (since 1890) |
| 9.56" in 1970 | 10.21" in 1970 | 8.37" in 1955 |
| 9.94" in 1956 | 12.26" in 1956 | 10.17" in 1956 |
| 11.15" in 1910 | 12.95" in 1954 | 10.74" in 2002 |
| 12.15" in 1952 | 13.07" in 1953 | 10.98" in 1964 |
| 12.22" in 1933 | 13.95" in 1945 | 12.48" in 1954 |
| CAUSE | ||||||
|
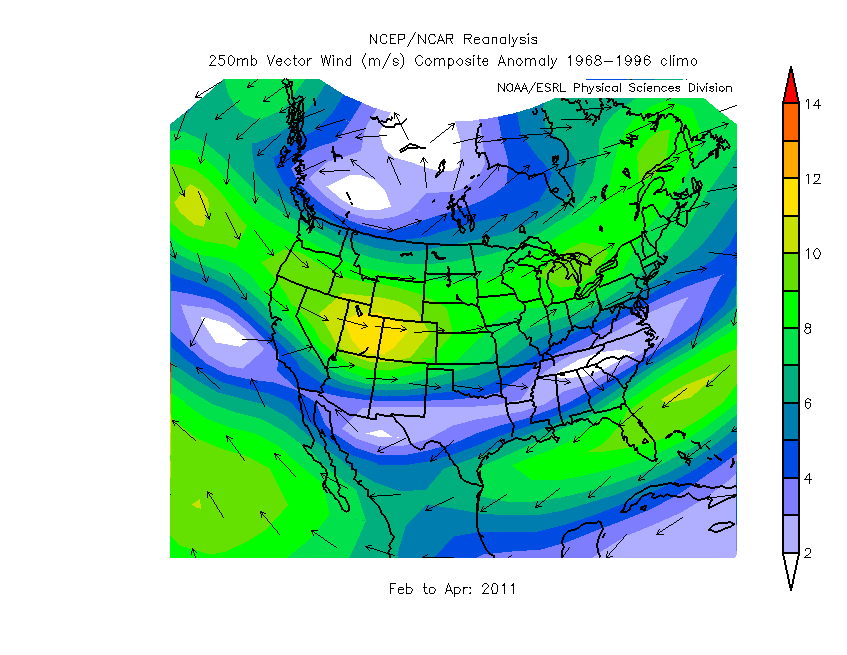
To explain the cause of the drought, we have to look at the weather pattern. So, what type of weather pattern has caused this drought? To answer that, we have to go back to the early summer of 2010 when La Nina officially began in the equatorial Pacific Ocean. A coupled ocean-atmosphere interaction develops due to the sea surface temperature anomalies (e.g. El Nino Southern Oscillation, or ENSO) in the equatorial Pacific Ocean, but it can take months before the two become synced. During this particular La Nina event, it took several months before the atmospheric pattern began to exhibit a "typical" La Nina pattern. The Panhandles really began to experience the La Nina pattern beginning in December, and it has persisted through late spring despite La Nina weakening.
Until the coupled ocean-atmosphere interaction associated with La Nina breaks down, it appears that this weather pattern will continue. However, there is some good news we can offer regarding the winds. Climatologically, as we head into the summer, the jet stream will continue to shift towards the northern U.S., which will substantially lessen the number of windy days across for the Panhandles. |
|
EFFECTS & IMPACTS |
||
| Due to the lack of precipitation, severe to exceptional drought conditions have developed across all of the Panhandles within the last few months. Exceptional drought conditions (the worst drought intensity based on the U.S Drought Monitor) are being experienced across the northwestern and eastern parts of the Panhandles. Of the 22 counties in our forecast area, portions of 11 counties are currently experiencing an exceptional drought, according to the Drought Monitor (Image 4) released on May 26. In order to reverse the drought intensity, it will take several widespread, moderate to heavy rainfall events. |  Image 4. Weekly U.S. Drought Monitor for May 26 |
|
|
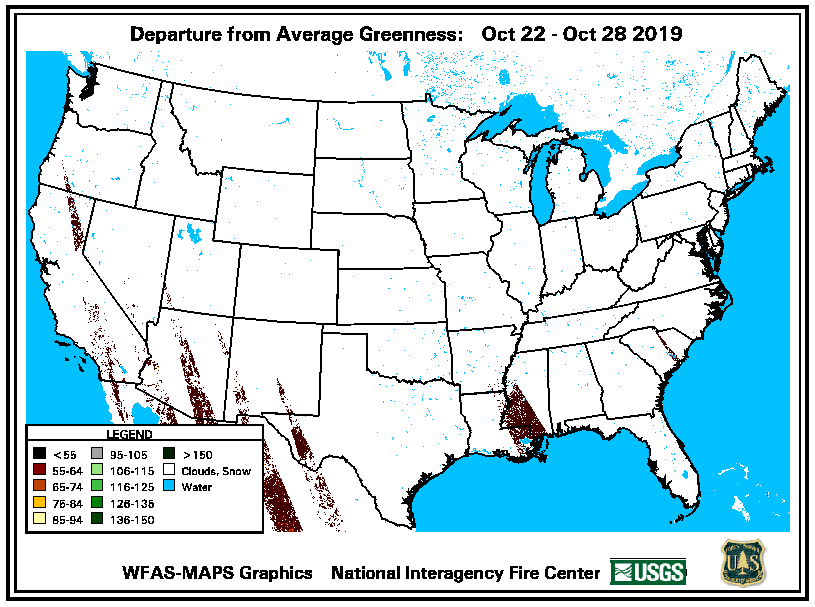
The combination of the weather pattern and the ongoing drought have allowed the wildfire season to continue unusually late into the season. The wildfire season typically ends around early May as vegetation begins to green-up and the weather pattern becomes less favorable, but most of the area has experienced very little in the way of green-up. In fact, greeness departures from average (Image 5) remain between 55 and 75% across the entire area. As a result, favorable fire weather conditions remain a big concern across the area. In fact, large or high-impact wildfires ignited as recently as May 29 across Potter and Randall Counties, including Amarillo, and on May 24 in Palo Duro Canyon, Hereford, TX, and south of Goodwell, OK. Until grasses and other fuels can be subjected to higher moisture content for a sustained period of time, the threat for fires will remain higher than normal. |
Image 5. Departure from Average Greenness from May 17-May 23
|
|
| Although residents of the Panhandle would like to see rain, they probably won't complain about the lack of severe weather so far this year. In fact, there have only been 15 preliminary reports of severe weather across our warning area, including 10 hail reports, five wind reports, and zero tornado reports. Our office has issued 15 severe thunderstorm warnings and zero tornado warnings. Comparatively speaking, through May 30 last year, our office had already issued 98 severe thunderstorm warnings and 55 tornado warnings.
Largely thanks to the weather pattern discussed above, the severe weather season is off to a very slow start. Many places to our east, however, have been hammered by severe weather due to a combination of above normal temperatures, moisture, and wind shear. Despite an unfavorable pattern for severe weather and tornadoes across the Panhandles so far, there has been at least one tornado reported every year since 1950. There have been a handful of years with less than five reported tornadoes, including one tornado in 1952 and only two tornadoes in 1953, 1954, 1956, and 1998. Three tornadoes were reported in 1985 and four tornadoes were reported in 1950, 1964, and 1988. Currently, 2011 is the 8th latest start to a year without a tornado (Table 3).
Table 3. Latest date of the first reported tornado in the Texas and Oklahoma Panhandles since 1950.
|
| PRECIPITATION & DROUGHT OUTLOOK | ||||||||
|
During the next 8 to 14 days, the Climate Prediction Center (CPC) is forecasting a 44% chance of precipitation being below normal across the entire Texas Panhandle (Image 6). During the month of June, the CPC is again forecasting below normal precipitation for the entire area (Image 7) with the higher probabilities for below normal precipitation across the southern Texas Panhandle. This is bad news for the because June is climatologically our wettest month of the year. The CPC's three-month outlook (Image 8) for June, July, and August indicates the Panhandles will have equal chances for above, below, or normal precipitation. Equal chances means that there is not a strong enough signal present to be confident about precipitation probabilities.
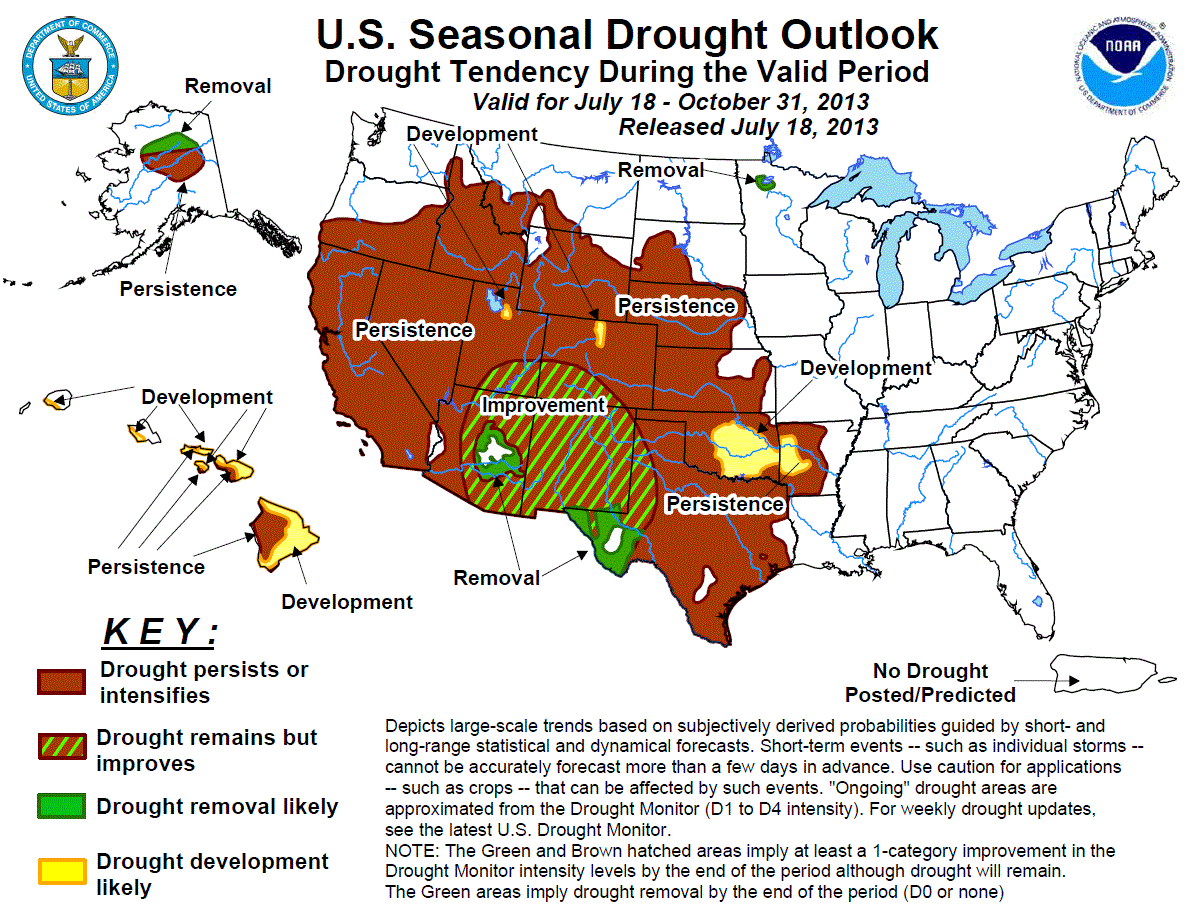
The three-month outlook is likely being influenced by the state of the sea surface temperatures in the equatorial Pacific Ocean, which is currently tied to La Nina. Over the last couple of months, La Nina has rapidly weakened, and in fact, the CPC is forecasting La Nina to dissipate in June with El Nino Southern Oscillation (ENSO) neutral conditions to develop thereafter. Before we get too excited about this, it typically takes a few months for the atmospheric circulation patterns to adjust themselves. Therefore, it seems reasonable to expect that La Nina's influence on the weather pattern will diminish by the end of July or August with a more typical weather pattern evolving. If that does indeed occur, unfortunately, the normal monthly precipitation across the Panhandles will be on the decline as we head into the late summer and fall. Nonetheless, the CPC is forecasting some drought improvement across most of the Panhandles (Image 9). We will certainly be keeping our fingers crossed for this outcome! |


