
Lake effect snow will impact the Great Lakes region through the day. Gusty winds will pick up across the Midwest, Northeast and Mid-Atlantic beginning this afternoon following a cold front. Elevated fire weather conditions will persist across the Desert Southwest today, with critical fire weather conditions developing Wednesday and Thursday in the Southern Plains. Read More >
 |
 |
 |
|
|
Current Weather
| NOAA Ports | Port Weather | Buoy Data |
 |
 |
 |
| Marine Observations as of 7:00 AM EDT Tue Apr 15 2025 | |||||||
| Location | UTC TIME | Air Temp (°F) |
Water Temp (°F) |
Wind (DIR/SP/Gust) |
Pres (mb) |
Wave&Swell (HT/PER) |
|
| Baltimore Harbor | 1030 | 60 | 53 | CALM / 4 | N/A | ||
| Tolchester Beach | 1030 | 59 | 220/ 8/ 10 | 1002.4 | |||
| Francis S Key Br | 1030 | 60 | 260/ 7/ 7 | 1002.6 | |||
| Cambridge MD | 1030 | 59 | 54 | 280/ 2/ 3 | 1003.4 | ||
| Thomas Pt, MD | 1100 | 61 | 230/ 13/ 14 | 1004.2 | |||
| Gooses Reef, MD | 1048 | 57 | 53 | 250/ 10/ 12 | N/A | 0 | |
| Cove Pt, MD | 1030 | 61 | 250/ 12/ 16 | 1003.3 | |||
| Piney Pt, MD | N/A | N/A | N/A | N/A | N/A | N/A | N/A |
| Bishops Head, MD | 1030 | 58 | 56 | 290/ 4/ 4 | 1003.3 | ||
| Potomac, MD | 1048 | 56 | 54 | 270/ 10/ 12 | N/A | 0 | |
| Solomons Island, MD | N/A | N/A | N/A | N/A | N/A | N/A | N/A |
| Lewisetta, VA | 1030 | 62 | 56 | 250/ 7/ 8 | 1003.4 | ||
| Dahlgren, VA | 1030 | 61 | 58 | 290/ 2/ 5 | 1003.8 | ||
| Rappahannock Light | 1030 | 200/ 11/ 12 | 1005.4 | ||||
| StingRay Pt | N/A | N/A | N/A | N/A | N/A | N/A | N/A |
| Yorktown, VA | 1030 | 63 | 59 | 210/ 9/ 11 | 1003.7 | ||
| Buoy 44072 York | 1048 | 58 | 58 | 240/ 8/ 10 | N/A | 1 | |
| Jamestown, VA | N/A | N/A | N/A | N/A | N/A | N/A | N/A |
| Willouby Stn, VA | 1030 | 64 | 240/ 11/ 13 | 1004.5 | |||
| Dominion Term Stn | 1030 | 63 | 220/ 10/ 11 | 1004.9 | |||
| Money Pt | 1030 | 63 | 61 | 230/ 4/ 6 | 1004.7 | ||
| Sewells Pt | 1030 | 64 | 60 | 1004.0 | |||
| Kiptopeke, VA | 1030 | 59 | 56 | CALM / 4 | 1004.2 | ||
| Ches Bay Bridge | 1030 | 63 | 220/ 5/ 7 | 1003.5 | |||
| Cape Henry,VA | 1030 | 65 | 210/ 9/ 13 | 1004.6 | |||
| Lewes, DE | 1030 | 62 | 50 | 190/ 7/ 10 | 1002.5 | ||
| Buoy 44009 | 1040 | 51 | 47 | 230/ 6/ 8 | 1002.7 | ||
| Brandywine Light | 1030 | 61 | 250/ 18/ 18 | 1002.4 | |||
| Ocean City Inlet | 1030 | 62 | 52 | 280/ 8/ 10 | 1001.4 | ||
| Wachapreague, VA | 1030 | 60 | 60 | 260/ 4/ 5 | 1003.6 | ||
| Wallops Island Buoy | 1056 | 51 | N/A | 2 | |||
| Cape Henry Buoy | 1026 | 56 | N/A | 2 | |||
| Cape Charles Buoy | N/A | N/A | N/A | N/A | N/A | N/A | N/A |
| 1st Landing Buoy | N/A | N/A | N/A | N/A | N/A | N/A | N/A |
| Buoy 44014 | 1050 | 55 | 50 | 210/ 14/ 16 | 1005.0 | 4 | |
| Duck Pier | N/A | N/A | N/A | N/A | N/A | N/A | N/A |
| Buoy 44056 | N/A | N/A | N/A | N/A | N/A | N/A | N/A |
| Buoy 44100 | 1030 | 64 | 56 | 220/ 9/ 12 | 1005.8 | ||
| Oregon Inlet, NC | 1030 | 64 | 64 | 250/ 13/ 16 | 1007.0 | ||
| Buoy 41025 | 1040 | 55 | 230/ 17/ 23 | 1007.8 | |||
| Cape Lookout, NC | N/A | N/A | N/A | N/A | N/A | N/A | N/A |
 |
 Northeast Regional Radar Loop |
 NWS Wakefield, VA Radar Loop |
 Dover, AFB |
 Newport/Morehead City, NC |
 Raleigh, NC |
 Sterling, VA |
 Blacksburg, VA |
 Fort Dix, NJ |
||
| Click Here for Interactive Radar Display | ||||
 Atlantic Coast Visible Loop |
 Atlantic Coast IR Loop |
 Tropical Atlantic Loop |
| LATEST FORECAST DISCUSSION |
DAILY MARINE THREAT
| TODAY | TOMORROW | DAY 3 | DAY 4 | DAY 5 |
 |
 |
 |
 |
 |
 |
||||
HOURLY WEATHER GRAPHS
|
|
| Complete Wind Gust Likelihood and Probabilities Page |
LIKELIHOOD OF WIND GUSTS
| 25 KT LIKELYHOOD | 34 KT LIKELYHOOD | 43 KT LIKELYHOOD | 48 KT LIKELYHOOD | FORECAST WIND GUST | HIGH END WIND GUST |
 |
 |
 |
 |
 |
 |
SUSTAINED WIND PROBABILITY
| Chesapeake Light VA | Cape Charles Light VA | Pilot Area | Sewells Point |
 |
 |
 |
 |
WIND GUST PROBABILITY
| Chesapeake Light VA | Cape Charles Light VA | Pilot Area | Sewells Point |
 |
 |
 |
 |
DETAILED MODEL WAVE FORECAST
| Cape Charles Wave Plot | Cape Henry Wave Plot | CBBT Wave Plot | Chesapeake Light Wave Plot |
 |
 |
 |
 |
NEAR SHORE WAVE MODEL
| WAVES | CURRENTS | WAVE PERIOD/DIRECTION |
 |
 |
 |
|
|
|
509 PM EDT MON APR 14 2025 TIDAL INFORMATION. FOR SEWELLS POINT. LOW TIDE AT 05:29 AM Tue. HIGH TIDE AT 11:27 AM Tue. LOW TIDE AT 05:18 PM Tue. HIGH TIDE AT 11:40 PM Tue. LOW TIDE AT 06:04 AM Wed. HIGH TIDE AT 12:03 PM Wed. LOW TIDE AT 05:51 PM Wed. |
| SEWELLS POINT TIDE DATA | CHESAPEAKE BAY BRIDGE TUNNEL TIDE DATA | JAMES RIVER/JAMESTOWN SCOTLAND FERRY TIDE DATA | ELIZABETH RIVER (MONEY POINT) TIDE DATA |
| TIDAL IMPACT VS LEVEL BELOW | |||
 |
 |
 |
 |
| LYNNHAVEN INLET TIDE DATA | HRBT TIDE DATA | MIDTOWN TUNNEL TIDE DATA | YORKTOWN TIDE DATA |
| TIDAL IMPACT VS LEVEL BELOW | |||
 |
 |
 |
 |
COASTAL FLOOD THREATS NEXT SEVERAL DAYS
| TODAY | TOMORROW | DAY 3 | DAY 4 |
 |
 |
 |
 |
CLICK HERE FOR SURF ZONE/BEACH FORECAST |
 |
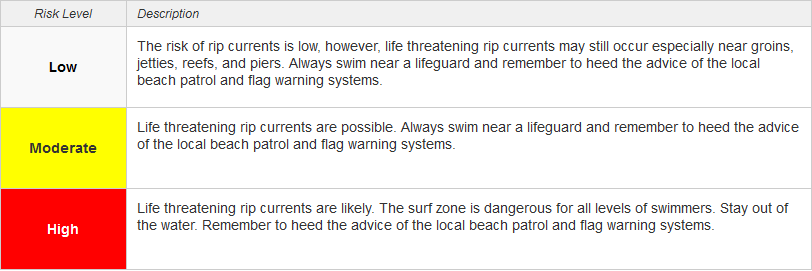 |
| Ocean City Rips | Assateague Rips | Virginia Beach Rips | Corolla Rips |
 |
 |
 |
 |


 Coastal Flood
 Heat
Heat