
Juneau Internet Outage Impacts Read More >
|
Suicide Basin is a side basin of the Mendenhall Glacier above Juneau, Alaska. Since 2011, Suicide Basin has released glacier lake outburst floods that cause inundation along Mendenhall Lake and River annually with a record major flood event taking place on August 6, 2024. The latest release took place on October 20, 2024. Monitoring Equipment Status: The USGS monitoring equipment is up and running. We will get 1 image from each of the 2 cameras per day. The USGS laser sensor data is active. There can be jumps or drops in the data from large ice bergs movement within the laser field of view. Basin/River Status: The Mendenhall River crested at 16.65ft at 7:15am on 8/13. This exceeded the previous record from 2024 of 15.99ft. The NWS and its partners will compile an event report in the coming weeks that will be posted here. The NWS and its partners will continue to monitor the basin as it begins to refill into the fall season. Please check back for updates.
Educational videos about outburst floods, how to find data, terminology and other information are on NWS Juneau's YouTube channel, here.
|
Visit the Juneau Glacial Flood Dashboard to learn more about Suicide Basin and flood impacts including: inundation maps, forecast data basics, history, and other FAQ! |
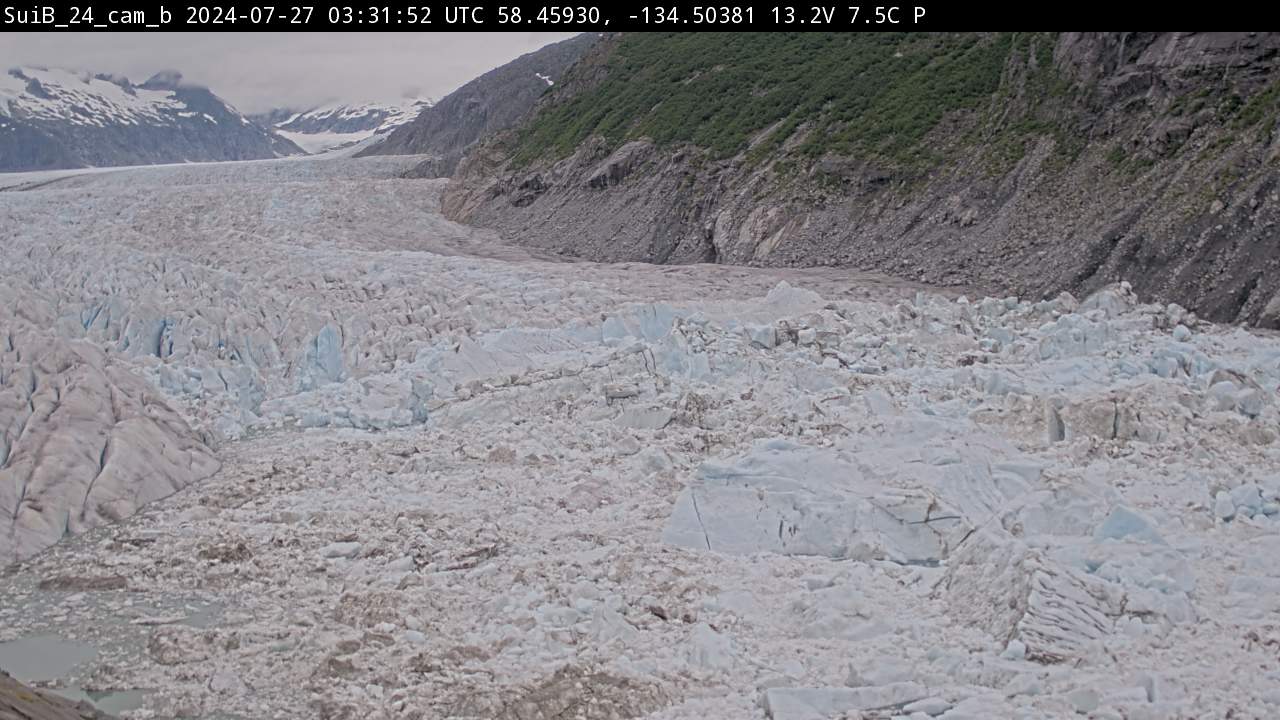
Latest Basin Image - ScalesMost recent image from the basin, updated at daily to sub-daily intervals (see time-stamp bottom right). The camera is placed at the basin entrance and faces northeast, into the basin. Click on image to enlarge and read basin levels. Click on the links below the image to see a full-season viewer or recent timelapse.
|
Latest Basin Image - VectorsMost recent image from the basin (same as on the left) with vectors indicating ice motion direction and magnitude. Click on image to enlarge. Click on the links below the image to see a full-season viewer or recent timelapse.
|
Latest Basin Image - Front of BasinMost recent image from the camera taking images with a view of the front of the basin. This image will be updated at daily to sub-daily intervals. Click on the image to enlarge. Click on the links below the image to see a full-season viewer or recent timelapse.
|
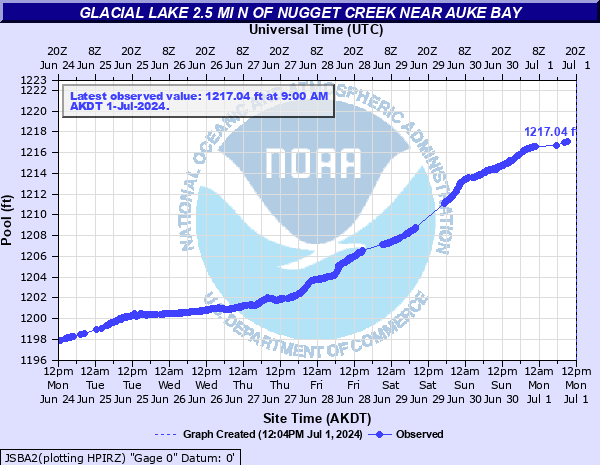
Suicide Basin Level (Pool Height)Graph showing the current (blue) pool height of Suicide Basin. Click on the image for more details (NWPS). At this time, values are from the USGS laser detection system.
|
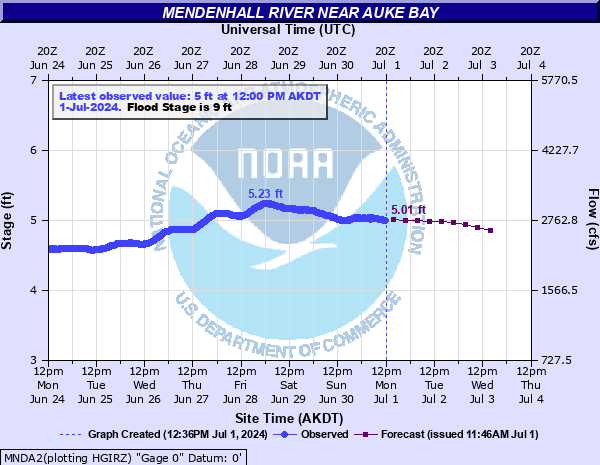
Mendenhall Lake Stage LevelGraph showing the current (blue) and predicted (purple) stage level at Mendenhall Lake. Stage levels are annotated on the left y-axis on the graph. The graph also shows the Mendenhall River discharge (right y-axis), which is derived from the Mendenhall Lake stage level via rating curve. Click on the image for more details (NWPS).
|
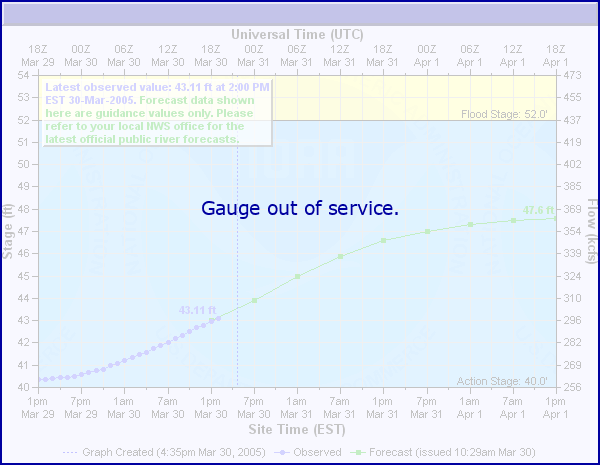
Mendenhall River Stage Level @ Backloop BridgeGraph showing the current (blue) stage level of the Mendenhall River at the Backloop Bridge. Stage levels are annotated on the left y-axis on the graph. Click on the image for more details (NWPS). NOTE: Refer to the Mendenhall Lake gauge for forecast data and impact statements.
|
Mendenhall River Stage Level @ Pedestrian BridgeGraph showing the current (blue) stage level of the Mendenhall River at the Pedestrian Bridge. Stage levels are annotated on the left y-axis on the graph. Click on the image for more details (NWPS). NOTE: Refer to the Mendenhall Lake gauge for forecast data and impact statements.
|
Mendenhall River Stage Level @ Brotherhood BridgeGraph showing the current (blue) stage level of the Mendenhall River at the Brotherhood Bridge. Stage levels are annotated on the left y-axis on the graph. Click on the image for more details (NWPS). NOTE: Refer to the Mendenhall Lake gauge for forecast data and impact statements.
|
Mendenhall Lake Forecast ScenariosGraph showing a modeled near 100% release forecast (gray) and the current no-release forecast (blue). This image is updated once daily in the afternoon starting in late May / early June.
 |
 |
||
|
|
|
|


