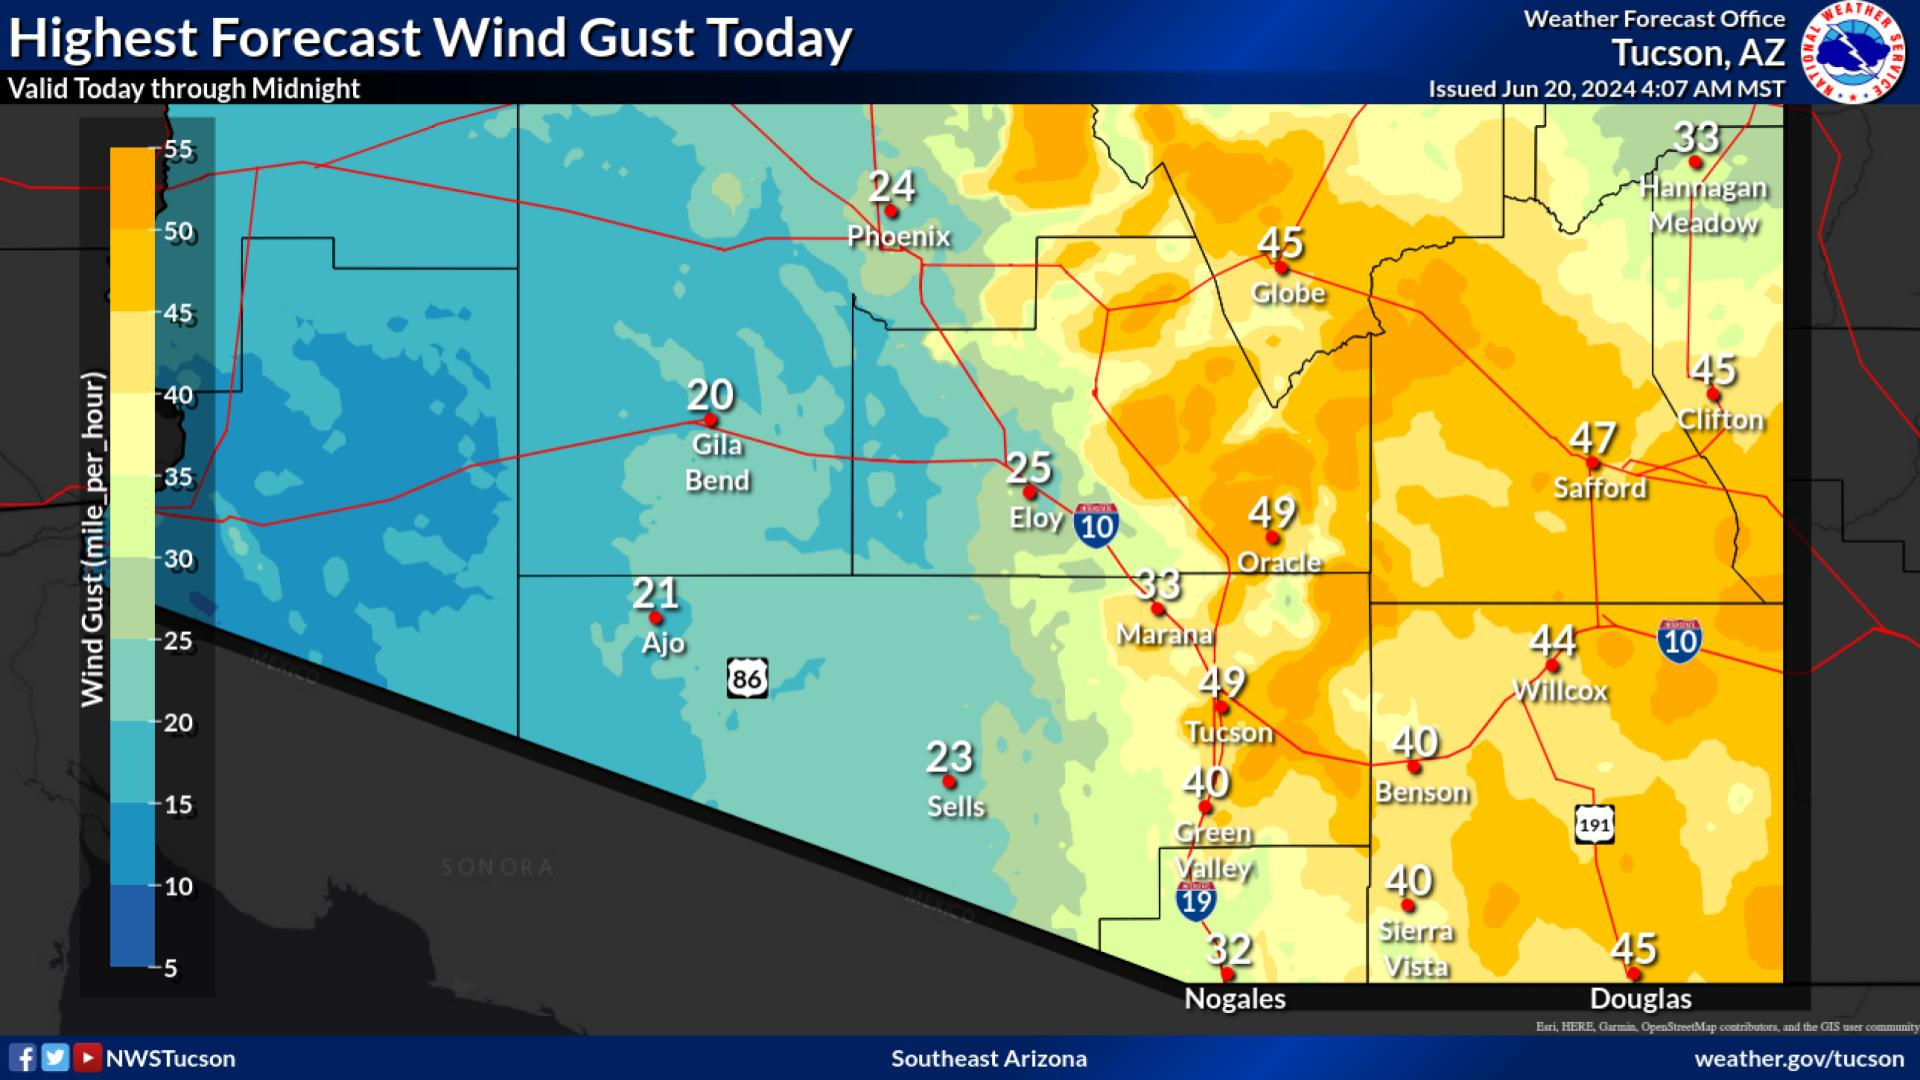
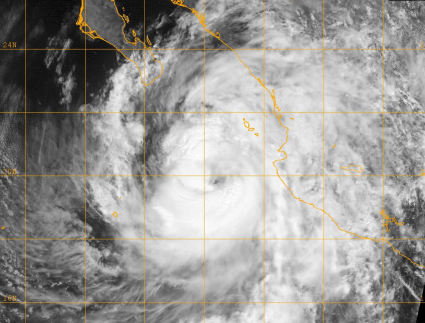
Tropical Storm Rachel is expected to track toward Baja on Saturday, while Tropical Storm Simon moves north into Sinaloa on Monday, bringing breezy to windy conditions on Sunday and drawing atmospheric moisture across the region through early next week. Rain chances begin Saturday and linger into Tuesday, with expected precipitation totals reaching 0.25 to 0.75 inch in the valleys and 1 to 2 inches in higher mountain elevations.







 Forecast Discussion
 Tucson Radar
 MRMS radar imagery
 GOES-18
 Southern Arizona
 Detailed Hazards
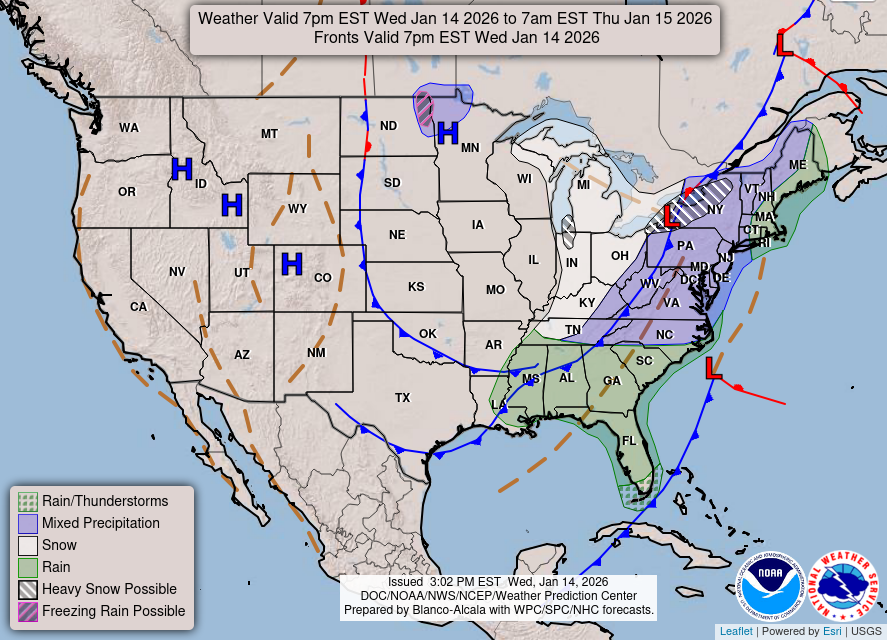 Weather Map
 Graphical Forecasts
 Heat Risk
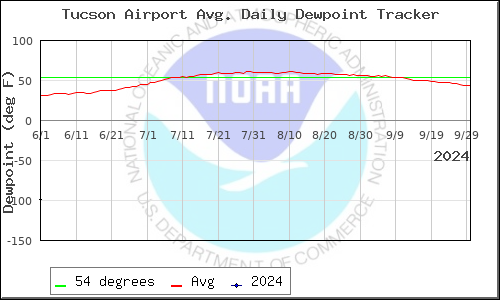 Monsoon
 Climate Graphs & Charts
 Fire Weather
 Tropical
 Hydrology
 Skywarn
 Drought Page
 Past Tucson Climate reports
 Hourly Forecasts
 Follow us on X
 Follow us on Facebook
 Follow us on YouTube
 TWC RSS Feed