Social Impacts of Graphical Forecasts to Users
by Fred McMullen
Abstract
Demonstrating desideratum for digital forecasts in the information era and provide social impacts on users in lieu of text-based forecasts.
Introduction:
For years, National Weather Service (NWS) meteorologists produced a text Zone Forecast Product (ZFP), detailing weather in twelve-hour intervals out seven days (shown in Fig. 1). However per recent technology advances, movement towards a digital forecast is critical. To continue existing encroachment of supplying usable products, the Weather Service transitioned to a graphical forecast, while the capability of routinely issued text products like the ZFP remained.
WVZ015-026-130100-
KANAWHA WV-BOONE WV-INCLUDING THE CITY OF...CHARLESTON
341 AM EDT MON APR 12 2004

.TODAY...RAIN. HIGHS AROUND 40. SOUTHEAST WINDS 10 TO 15 MPH WITH
GUSTS UP TO 25 MPH.
.TONIGHT...CLOUDY WITH RAIN WITH A CHANCE OF SNOW SHOWERS. LITTLE OR
NO SNOW ACCUMULATION. COLD WITH LOWS IN THE LOWER 30S. SOUTHWEST
WINDS 10 TO 15 MPH.
.FRIDAY...CLOUDY WITH A 30 PERCENT CHANCE OF SNOW SHOWERS. HIGHS IN
THE UPPER 30S. SOUTHWEST WINDS 10 TO 15 MPH.
.FRIDAY NIGHT...MOSTLY CLOUDY. COLD WITH LOWS IN THE MID 20S. WEST
WINDS 5 TO 10 MPH WITH GUSTS UP TO 20 MPH.
.SATURDAY...PARTLY CLOUDY. HIGHS IN THE UPPER 30S. WEST WINDS AROUND
5 MPH.
.SATURDAY NIGHT THROUGH WEDNESDAY...PARTLY CLOUDY. LOWS IN THE LOWER
20S. HIGHS IN THE MID 30S.
Fig. 1. Example of a Zone Forecast Product
The Graphical Forecast Editor software (GFE) implementation increased the number of products the NWS procreated, but most significance was a gargantuan step into the digital era. NDFD is an acronym characterizing various weather parameters created by NWS offices mosaic together. NDFD is short for the National Digital Forecast Database. NDFDs execution was highly appreciated by private sector companies, since ingestion of nationally collaborated and professionally modified forecasts are possible. The completion process took approximately two years as 122 field offices in coordination with six national centers worked through software spin up and inconsistencies along borders. GFE retains the full complement of text products that customers are accustomed; the difference is they are processed through computer programs oppose to manual composition, hands off mentality. The main upside to the digital database is products like the ZFP, created with minimal editing unlike the past, plus proffering a host of graphical images and cutting edge products like the Area Forecast Matrix (AFM) (Fig. 2). Subsequent products fall out from the AFM and are viewable on the World Wide Web, for instance the graphical AFM (Fig. 3). Initial resolution of graphical forecasts resolves down to five kilometers with potential further grid resolution to two and a half kilometers.
WVZ015-026-122226-
KANAWHA WV-BOONE WV-
INCLUDING THE CITY OF...CHARLESTON
326 AM EDT MON APR 12 2004

DATE             THU 12/15/05            FRI 12/16/05            SAT 12/17/05
UTC 3HRLY     08 11 14 17 20 23 02 05 08 11 14 17 20 23 02 05 08 11 14 17 20 23
EST 3HRLY     03 06 09 12 15 18 21 00 03 06 09 12 15 18 21 00 03 06 09 12 15 18

MAX/MIN                      42    26 31 33    32 38 39    22 25 29    33 37 42
TEMP             34 34 39 41 38 36 35 34 33 34 37 38 35 32 30 29 27 28 34 36 32
DEWPT            28 29 32 35 34 34 33 31 29 28 27 25 23 23 22 21 20 19 17 18 18
RH               78 82 76 79 85 92 92 89 85 78 67 59 61 69 72 72 74 68 49 47 56
WIND DIR         SE SE SE  S  S SW  W  W SW SW SW  W  W  W  W  W NW NW  W NW NW
WIND SPD          9 11 11  9  5  8 11 11  8  8 12 17 12  6  5  4  3  3  5  5  6
WIND GUST        26 31 28 21       21 24       24 29 23
CLOUDS           OV OV OV OV OV OV OV OV OV OV OV OV OV BK SC SC SC SC SC SC SC
POP 12HR                    100          80          20          20          10
QPF 12HR              0.30-0.55   0.00-0.13        0.01           0           0
SNOW 12HR                 00-00       00-00           T
FRZG RAIN         D
SNOW                                C  C
RAIN              D  D  D  D  D  C  C  C
SNOWSHWRS                                 S  S  S  S  S  S  S  S
WIND CHILL       25 26 32 35    30 26 25 25 27 29 30 26 26                   25
MIN CHILL        17    17    25    20    18    19    17    15    14    14    21
Fig. 2. Area Forecast Matrices are a new product in the NDFD era
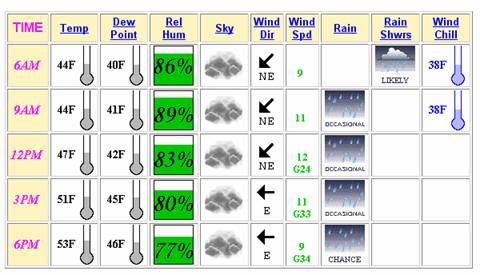
Fig. 3. Graphical AFM issued by the NWS in the NDFD era
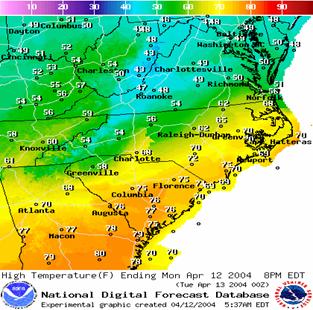
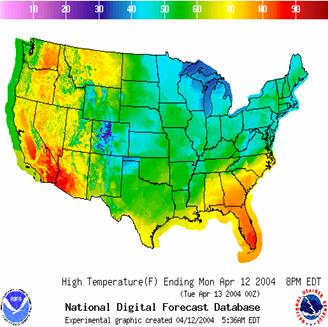
Weather Service headquarters released a timetable of various weather fields and their availability date, allowing companies time to acquire or allocate necessary resources. At a conference months prior to the release date, NWS demonstrated what is forthcoming, giving private sector firms a sneak preview. High and low temperatures along with 12-hour probability of precipitation were the first grids released, while sky, weather, rain and snow amounts, a myriad of fire weather elements follow several months later. Figure 4 illustrates several fields currently available.
 |
 |
|
|
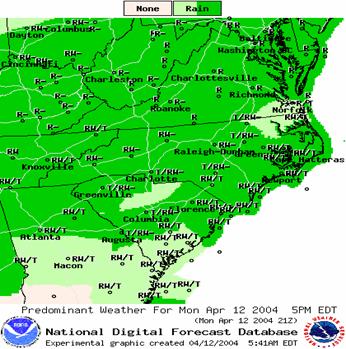 |
Fig. 4. An example of NDFD images on April 12th 2004, top left corner high temperature for the mid-Atlantic, while the top right corner national maximum high temperature for the same day.Bottom examples from left to right: 12hr probability of precipitation and predominant weather at April 12th.
After the full compliment of weather fields become available, NDFD will compromise over 40 elements.Some fields will be offered every three hours are weather, sky, relative humidity, wind, and temperature, while fundamental grids of maximum temperature, minimum temperature, and 12-hour precipitation probability are offered once a day since they spans an entire forecast period.
Presently each weather forecast office s grid scale is five kilometers, once faster computer processing speed becomes accessible; the intent is reducing to two and a half kilometers, however to compensate a finer resolution, the number of pixels within GFE software inflates exponentially. Currently each office s domain is 144 by 144 grids, increasing resolution to 2.5 kilometers the domain expeditiously increases goes to 288 X 288. Computer-processing speeds must escalate four fold ensuring system requirements are not compromised, if they aren t then slower equipment translates to untimely issuance of grids.
Market for Graphical Forecasts:
For decades NWS forecasts were composed by hand and disseminated through various communications devices for local media outlets. Now private sector outfits and television stations can ingest girds, thereby reducing workload for meteorologists, shifting their focus onto hazardous weather and outreach activities. Private weather establishments reduce the workload in the graphic arts department, exonerating them from a suite of graphics. Additional time allotment could be directed to graphics detailing current droughts or locations in an abnormal wet spell, extreme heat, climate figures showing rainfall deficits, or educating the public on weather and safety. Meteorologists working in private firms instead of compromising a forecast can weigh NWS grids and make adjustments as one sees fit, while extra hours he/she can focus on regions where low forecast confidence exists, or apply as supernumerary / professional development time under benign weather patterns.
Demand for graphical weather images continues to rise, take for example the Weather Channel. Numerous executives turned their heads at a concept of 24-hour weather programming, but today Neilson ratings are topping 0.2 and times of widespread severe weather close to one million viewers. Online surveys by NWS field offices indicate the public prefers a forecast that is quick and easy to interpret, not a long drawn out 14 day forecast, since all the verbiages gets confusing and people lost sight of the short term. Information in graphical form accomplishes a fast and efficient mean in absorbing data. Instead of reading a seven-day forecast, users expeditiously hop online and quickly navigate through a mosaic of temperature and weather grids, similar to the four-panel illustrated above and resolve a forecast. Private companies grasp this concept nearly a decade ago, around the eruption of the information super highway, while television station have displayed graphical forecasts since the conception of local news. To give further understanding, a professor at MIT stated the following points about graphics and their relation to text:
1. A picture is worth a thousand words; the higher the information density, the better. As a corollary, a picture that is worth fewer than a thousand words should be removed from a document.
2. As with text, structure will be vital if large amounts of information are to be conveyed. Expository issues of purpose, context, beginning/middle/end, and design apply to graphics. Often the graphic's structure is predetermined and well known by both the reader and the author. When the structure is new, extra care must be taken to convey order the reader.
3. Graphics must convey information visually; the reader must be able to ``see'' something when looking at the figure. While the expository issues are similar, the principles of graphic design can be very different, and the tools and methods used to achieve visual impact are often quite different from those used to produce textual impact.
4. The use of graphics provides a second representation of the ideas found in the text. Such multiple representations have two benefits. First, because readers preferentially absorb information from some media, a variety of representations -- pictures, graphs, tables, and text -- give the reader a better chance of immediately grasping the author's idea. Secondly, these multiple representations provide a more complete picture of a complicated idea. If the reader can approach the same idea from different vantages, the big picture is more easily grasped.
The NWS took all points into consideration from properly labeling images, conveying a clear message what users should grasp, and consistency with the text forecast, since the forecast is derived from the pictures.
NDFD is expected to drive many programs in the upcoming years (Ruth 2000):
1. Decision support systems that fit the forecast to problem.
2. Weather information along a path.
3. Text generation in more than one language.
4. Forecast for vehicles and hand held devices with Global Positioning Systems.
5. Controls for smart appliances (e.g. heating, cooling, and irrigation)
6. Graphics for the mass media.
Items highlighted above typify demand for the NDFD in the upcoming years, as society further advances in the information era. Several additional fields are likely required in the future. For example, air quality charts given guidelines become more stringent for industries.
Television Community
Imagine all local television affiliates ingesting the identical forecast database! Neither images nor forecasts would fluctuate from station to station, so instead of one station predicting snow, the other rain, both forebode corresponding precipitation types. Some broadcast meteorologists pride themselves on anticipating daytime maximum temperatures plus or minus a few degrees; a digital database still empowers a continuation of this marketing ploy. For instance, showing viewers a NDFD map of forecast max temperatures with broad contours, say every 10 degrees then once its time to wrap up, flash their anticipated high on the screen in text.
Instead of apportioning hours in the afternoon detailing weather maps for the evening news, broadcast meteorologists could allocate time responding to email inquiries from viewers, promoting the television station via presentations, or acquiring professional seals (American Meteorological Society or National Weather Association) that are coveted by news directors with respect to filling vacancies.
The World of Amplitude and Frequency Modulation
For radio stations it s a bit different, the purpose of visualizations is limited since voice is the means of announcing information. The ability to affix specifics remains in tact. Radio disc jockeys can communicate to listeners weather information by reviewing graphical images on the Internet even in hinterland areas. Even though their preference would be recite text, quick snapshots of grids can give the jockey the required information. How warm will it get and will it rain? The four-panel image (Figure 4) all that is condign for compromising a short one or two 12-hr forecast. The Zone Forecast Product elicits its text from the NDFD, so even though the drive for graphical images isn t essential comparable to television stations, the text community is not left behind in the digital advancement of the NWS. If the path of narrating text is chosen, keep in mind the forecast lack creativeness and appealing adjectives considering the detail lies in the grids. Most disc jockeys usually construe the forecast for their listeners or abbreviate and stress main points, like fog or heavy rain, oppose to emphasizing light and variable winds. On a road trip in the northeastern United States last summer, I was listening to an alternative radio station, the DJ took a prediction of Mostly Sunny with highs in the mid 90s, light winds (knowing this after checking the NWS forecast) as Freakin hot . Once the data lies in the presence of the DJ they can interpret it anyway they see fit.
Ag Interests
Agricultural interests also play a pivotal role in the new digital era given the colossal impact weather has on financial security. Wet or dry seasons spell profit loss for farmers thus the dependence on hourly weather information, specifically relative humidity, rainfall amounts, wind speed and probability of precipitation. The aspiration of agrometeorology; help farmers optimally manage climatic resources, essentially sunshine and rainfall. Optimum water use means planting the appropriate crop given present ground moisture content, so crops use the uttermost amounts leaving nominal quantity for weeds, at the same time minimizing soil erosion and fertilizer loss because of water run-off. Quintessential use of sunshine is largely controlled by water availability (Gommes 1999). Graphical quantitative precipitation forecasts (QPF) drastically assists farmers, oppose to deciphering a text based rainfall output. Until recently graphical rainfall maps resided mostly in text, some maps existed, but resolution was poor. Most would say reading a rainfall forecast where predictions of 0.25 inches, in the major cities provides some benefit, however farms typically reside in rural sections, thus a rainfall forecast for a city 20 miles away service little purpose, especially in the summer, where amounts vary in a short distance. Viewable rainfall and temperature maps accounting for local topography allow for better planning. Farmers in the Midwest who possess sections of land (a section is one square mile) devoted to agricultural, can program pivots and strategically place equipment across areas where rainfall is forecast (or not). A map compromised of rainfall totals for the upcoming storm allows farmers to infer areas of highest and lowest totals, so they can quantify areas, which need watering. Cost savings measures congruous to digital images are another positive outcome of digital forecast product that the NDFD is able to provide.
A Safer Sky
Benefits of the NDFD expand into the aviation community as ceiling and visibility grids are forthcoming. Currently, pilots plan their flight path upon reviewing Terminal Aerodrome Forecasts (TAF) for departing and arrival destinations. Pilots also review any alerts pertaining to potential icing or thunderstorms, all are in text format. TAFs don t afford pilots weather information or potential aviation hazards outside a five nautical mile radius of the airport, which is the scope of a TAF, nor do TAFs propound weather information between departure and arrival airports. If pilots trust TAFs for the weather all along the flight path then they are making a substantial assumption, since that can be misleading if weather impacts along the flight path are expected, but not at the endpoints. Digital pictures of flight categories, cloud bases, and visibility restrictions greatly enhance planning efforts by airlines. The idea is create hourly cloud base and visibility pilots out 24 hours, enabling pilots to loop through the fields at a posthaste rate, outlining flight path conditions. Fields of wind and weather also are helpful to the aviation community currently are available, so all that is absent is addition of two elements, which extend 24 hours into the future. Having these images at their disposal, pilots aggrandize knowledge and situational awareness of an upcoming flight, resulting ultimately in safer travel.
Conclusion:
Technology and exigency for the National Weather Service to disperse beneficial up to date products, headquarters presented forecasters with a Hobson s choice of migrating into the digital era. The transitioned to a digital database and the NDFD concept had its ups and downs; feedback was overwhelming positive, validating emphasis of graphical forecasts with less accentuation on text products, which were previously the foundation of the organization.
Assets of a digital database are both internal to the NWS and external to users. Companies who implement NDFD in production and dissemination in a chain of weather products will discover a wealth of information. Outside short fuse warnings (i.e. Tornado and Flash Flood) that are transmitted seconds after their composition, the graphical forecasts will be updated frequently. Teaming the NDFD with geographic information systems (GIS) shall provide powerful capabilities.
REFERENCES
Dickman, I. R., 2002: NWS Eastern Region Interactive
Forecast Preparation System (IFPS) Implementation.
Preprints, Interactive Symp. on the Advanced
Weather Interactive Processing System (AWIPS), Orlando,
FL, Amer. Meteor. Soc., 28 32.
Glahn, H. R., 1970: Computer-produced worded forecasts.
Bull. Amer. Meteor. Soc., 51, 1126 1131.
, 1979: Computer worded forecasts. Bull. Amer. Meteor.
Soc., 60, 4 11.
, and B. Lawrence, 2002: GRIB2: The WMO standard
for the transmission of gridded data Current
status and NWS plans. Preprints, Interactive Symp.
on the Advanced Weather Interactive Processing System
(AWIPS), Orlando, FL, Amer. Meteor. Soc.,
J267 J269.
LeFebvre, T. J., C. Bacco, and M. Romberg, 1996:
Gridded forecast products and services under development
at FSL. Preprints, 15th Int. Conf. on Interactive
Information and Processing Systems for Meteorology,
Oceanography, and Hydrology, Norfolk, VA,
Amer. Meteor. Soc., 473 476.
Rezek, A., 2002: Changing the operational paradigm
with Interactive Forecast Preparation System (IFPS).
Preprints, Interactive Symposium on the Advanced
Weather Interactive Processing System (AWIPS),
Orlando, FL, Amer. Meteor, Soc., 23 27.
Ruth, D. P., 2000: Creating a National Digital Forecast Database of Official National Weather Service Forecasts. Preprints, 16th
Int. Conf. on Interactive Information and Processing
Systems for Meteorology, Oceanography, and Hydrology,
Long Beach, CA, Amer. Meteor. Soc., 82-85.
Ruth, D. P., 1998: Model interpretation using slider bars
in interactive forecast preparation. Preprints, 14th
Int. Conf. on Interactive Information and Processing
Systems for Meteorology, Oceanography, and Hydrology,
Phoenix, AZ, Amer. Meteor. Soc., 464 468.
M. A. Mathewson, T. J. LeFebvre, and P. K. Wu,
1998: Interpretation and editing techniques for interactive
forecast preparation. Preprints, 14th Int.
Conf. on Interactive Information and Processing Systems
for Meteorology, Oceanography, and Hydrology,
Phoenix, AZ, Amer. Meteor. Soc., 345 349.
Vogt, Heidi, 2000 Jan: Weather Channel asks: Won t you stick around. Media Life Magazine,
2002 Fall: MIT Open Course Ware, Writing and Humanistic Studies- Science and Engineering: Graphics, 20-21.
Also referenced was feedback received from users regarding images and personal preference on forecasts to National Weather Service Headquarters in Silver Spring, MD.


