
Widespread strong to severe storms are expected over much of Texas and in southern Oklahoma Tuesday, with potential for significant damaging wind and large hail. An Enhanced Risk (level 3 of 5) has been issued for central Texas. The threat of excessive rainfall could create localized areas of flash and urban flooding across Texas and southern Oklahoma Tuesday into Wednesday. Read More >
Lightning Flash Density Maps of Colorado, the United States and the World
Welcome to the Lightning Flash Density Map Page of the Colorado Lightning Resource Page. This page will link you to numerous lightning flash density maps for the state of Colorado. You can also view a lightning flash density map for the United States, and for the world.
Below are the links to the lightning flash density maps. The maps of Colorado and the United State show the number of Cloud to Ground (CG) lightning flashes per square kilometer per year. If you wish to convert flashes per square kilometer per year to flashes per square mile per year, multiply the values on the map by 2.59.
The lightning flash density maps of the world show total lightning activity, that is, Cloud to Ground (CG) lightning plus In-Cloud (IC) lightning.

**************************************
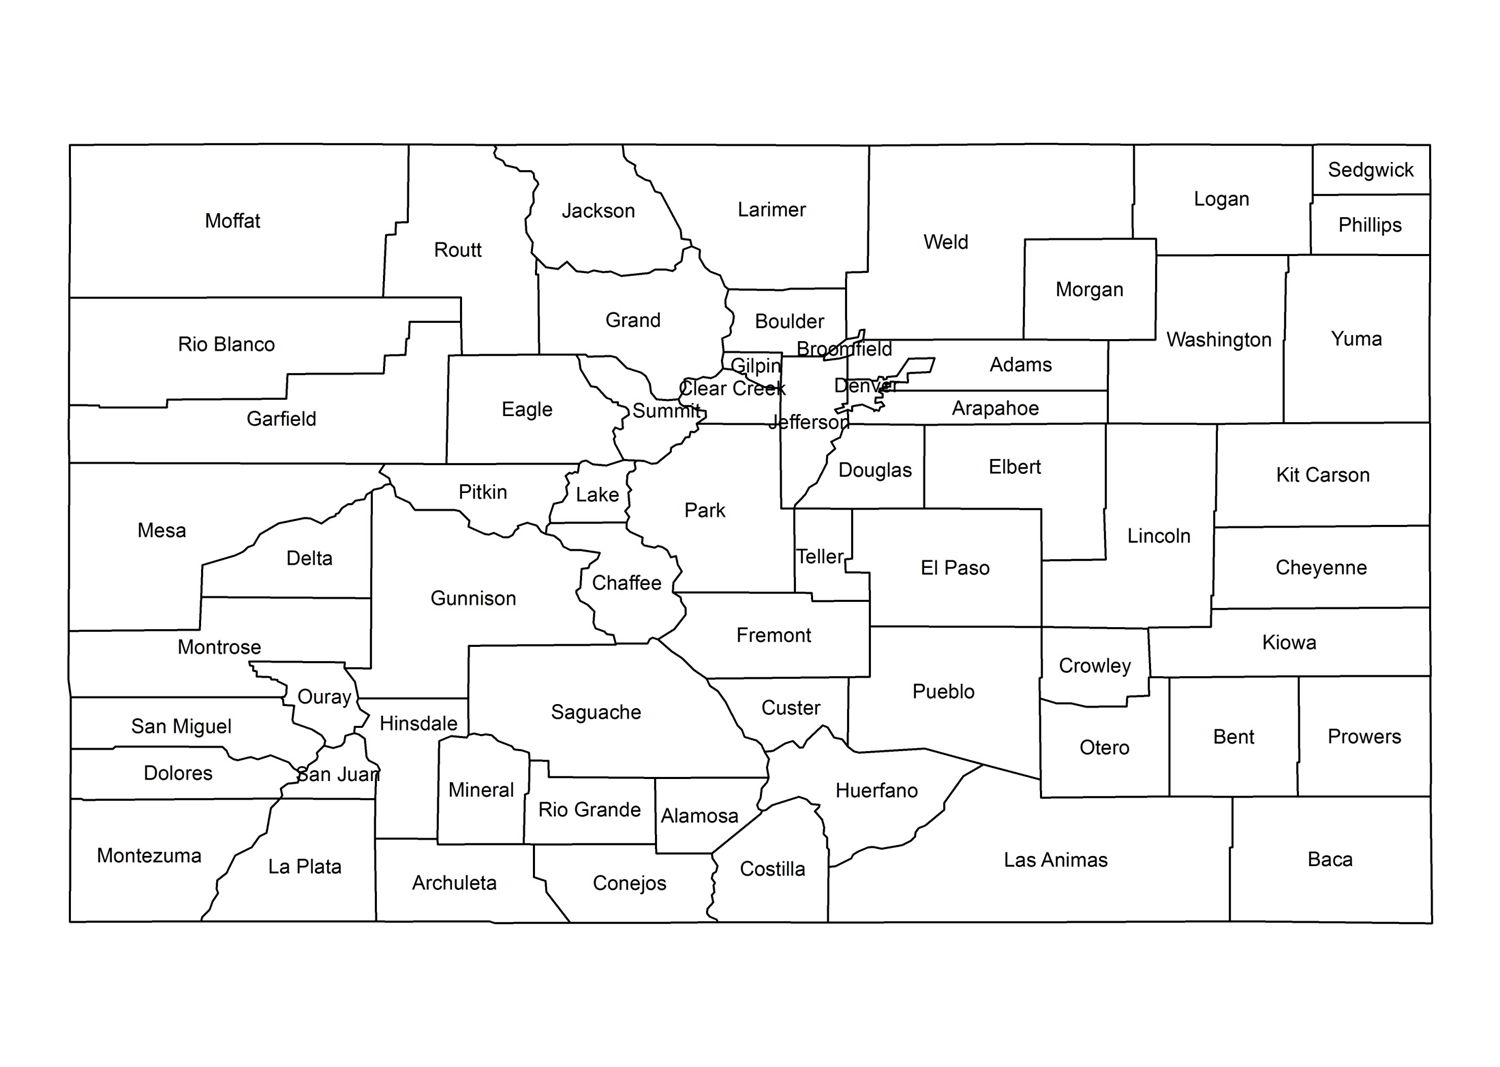
Above is a CG flash density map for the state of Colorado (data from 1996 through 2016. No county or city names are displayed on this map so that you can see the data more clearly. Here is a Colorado map with the county names displayed. Click on map for a high resolution image.
Hour-By-Hour CG flash density maps for the state of Colorado: Midnight, 1 am, 2 am, 3 am, 4 am, 5 am, 6 am, 7 am, 8 am, 9 am, 10 am, 11am, Noon, 1 pm, 2 pm, 3 pm, 4 pm, 5 pm, 6 pm, 7 pm, 8 pm, 9 pm, 10 pm, 11 pm.
Monthly CG flash density maps for the state of Colorado - JAN, FEB, MAR, APR, MAY, JUN, JUL, AUG, SEP, OCT, NOV, DEC.
Most of the CG lightning over the Continental United States occurs over the Gulf Coast states and Florida. Florida leads the nation for CG lightning flash density (# flashes per unit area). Many other States have much more CG lightning than Colorado. There is a misconception that Colorado is 2nd in the nation with respect to the amount of CG lightning activity; this is not true. The Centennial State ranks 32nd in the nation with respect to CG lightning flash density.
On average, about 22 million CG lightning flashes occur across the Continental United States every year. About 500,000 flashes occur across Colorado.
USA Flash Density Map (square miles)
USA Flash Density Map (square KM)
High resolution USA maps of flash density are available in this AMS science journal article PDF
State by State Lightning flash, and lightning flash density, comparisons (don't forget to scroll down once you get to this document)
More information about lightning across the Continental United States can be found here.
Lightning Flash Density of the World
This map shows the lightning flash density of the World. This map is different from the other maps as it includes ALL types of lightning (the Colorado maps and the United States maps only showed cloud to ground lightning flash density information). If you want to learn more about this map, go here. An excellent website to learn about lightning, and weather in general, can be found here.
.


 Follow us on YouTube