*Climate Data has been recorded at Barkley Regional Airport in West Paducah since 1949 and prior to that was observed in downtown Paducah back to December of 1937.
While Thanksgiving has been celebrated unofficially in the United States for many years, it was on October 3, 1863 that President Abraham Lincoln offically declared the last Thursday of November as Thanksgiving Day. In 1941, Congress moved the date to the fourth Thursday of November (effective in 1942), in part to clear confusion caused by a Proclamation issued by President Franklin D. Roosevelt, which had moved Thanksgiving to the 3rd Thursday in November in 1939-1941. For climate purposes, anytime from November 20th - 30th will be used depending on the the date the holiday was observed for a given year. Since 1942, Thanksgiving has always fallen between November 22nd - 28th.
Here is a look at high and low temperature frequencies and extremes as well as precipitation statistics for Thanksgiving in Paducah.
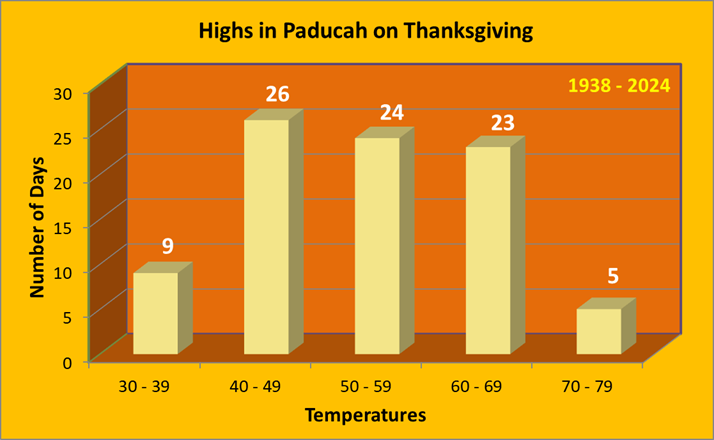
High temperatures typically fall in the 40s, 50s, or 60s on Thanksgiving with a nearly equal frequency of each.
| Warmest Highs | Coldest Highs |
| 74 in 1941 | 33 in 1958 |
| 72 in 1981 | 34 in 1938 |
| 70 in 2010 | 35 in 1980 |
| 70 in 1973 | 35 in 1956 |
| 70 in 1966 | 37 in 1952 |
| Normal High: | 52 - 55 |
Paducah has seen 9 years with highs stuck in the 30s, most recently in 2014. On the warm end of the spectrum, highs have been in the 70s on 5 occasions, most recently in 2010.
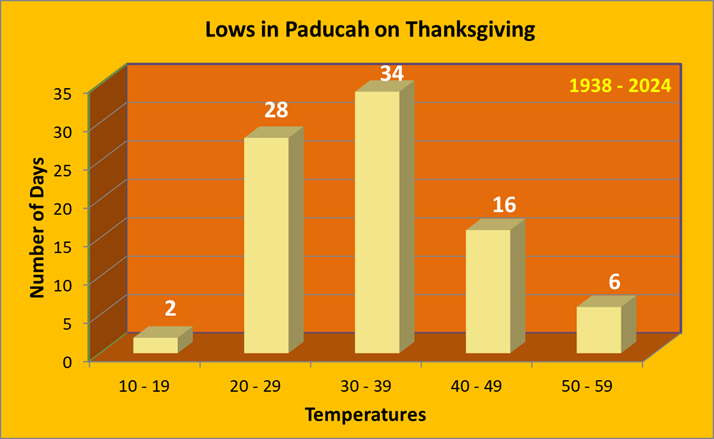
Low temperatures typically fall in the 20s or 30s on Thanksgiving, accounting for 70% of all years on record. There have been 2 years with lows falling into the teens, in 2013 and 1950. There have also been 6 years where the low was above 50. This last happened in 2015 when it only managed to fall to 57 degrees.
| Warmest Lows | Coldest Lows |
| 59 in 1940 | 15 in 1950 |
| 57 in 2015 | 17 in 2013 |
| 55 in 1991 | 20 in 2002 |
| 51 in 1978 | 20 in 1984 |
| 51 in 1965 | 20 in 1952 |
| Normal Low: | 33 - 36 |
Measurable precipitation has fallen 28% of the time, with over an inch of precipitation falling on 4 different occasions, with 2003 being the last time this happened. There has only been one Thanksgiving with measurable snow and this occurred back in 1950 when 1.3 inches fell.
| Wettest | Snowiest |
| 1.94 in 1968 | 1.3 in 1950 |
| 1.52 in 2003 | |
| 1.40 in 1979 | |
| 1.04 in 1987 | |
| 0.94 in 2010 |
Here is a look at the observed weather for the past 15 years:
| Recent Weather for Thanksgiving | |||
| Year | High | Low | Precip |
| 2010 | 70 | 33 | 0.94 |
| 2011 | 48 | 35 | 0 |
| 2012 | 65 | 33 | 0 |
| 2013 | 45 | 17 | 0 |
| 2014 | 38 | 25 | 0 |
| 2015 | 69 | 57 |
T |
| 2016 | 54 | 45 | T |
| 2017 | 53 | 22 | 0 |
| 2018 | 63 | 28 | 0 |
| 2019 | 41 | 33 | 0.18 |
| 2020 | 49 | 36 | 0 |
| 2021 | 57 | 29 | 0.44 |
| 2022 | 55 | 36 | 0.08 |
| 2023 | 60 | 31 | 0 |
| 2024 | 45 | 30 | 0 |
*Climate Data has been recorded at Evansville Regional Airport since January of 1897. Snowfall records began in January of 1948.
While Thanksgiving has been celebrated unofficially in the United States for many years, it was on October 3, 1863 that President Abraham Lincoln offically declared the last Thursday of November as Thanksgiving Day. In 1941, Congress moved the date to the fourth Thursday of November (effective in 1942), in part to clear confusion caused by a Proclamation issued by President Franklin D. Roosevelt, which had moved Thanksgiving to the 3rd Thursday in November in 1939-1941. For climate purposes, anytime from November 20th - 30th will be used depending on the the date the holiday was observed for a given year. Since 1942, Thanksgiving has always fallen between November 22nd - 28th.
Here is a look at high and low temperature frequencies and extremes as well as precipitation statistics for Thanksgiving in Evansville.
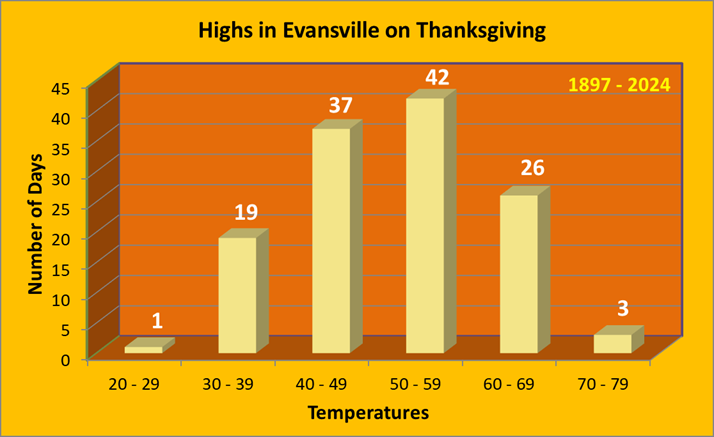
As seen by this graphic high temperatures are predominately in the 40s or 50s on Thanksgiving, encompassing 59% of all years on record.
| Warmest Highs | Coldest Highs |
| 70 in 2015 | 25 in 1930 |
| 70 in 1981 | 30 in 1903 |
| 70 in 1966 | 31 in 1972 |
| 69 in 1933 | 31 in 1956 |
| 69 in 1915 | 31 in 1905 |
| Normal High: | 50 - 53 |
Evansville has cracked 70 three times on Thanksgiving, in 2015, 1981, and 1966. There have also been 5 years where the high temperature failed to reach 32 degrees. This last occurred back in 1972.
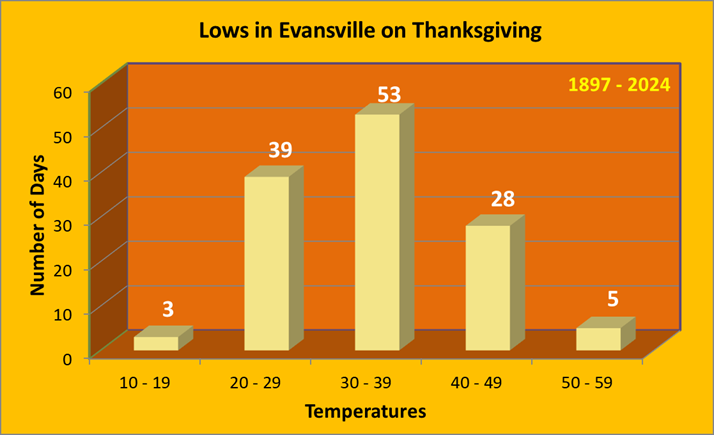
Low temperatures typically fall into the 20s or 30s, accounting for 71% of the years on record. Temperatures have fallen into the teens on 3 occasions, most recently in 2013. On the warm end of the spectrum, lows have fallen into the 50s 5 times, most recently in 2015.
| Warmest Lows | Coldest Lows |
| 56 in 1915 | 13 in 1950 |
| 53 in 2015 | 13 in 1930 |
| 53 in 1933 | 17 in 2013 |
| 51 in 1913 | 20 in 2005 |
| 50 in 1966 | 20 in 1911* |
| Normal Low: | 32 - 34 |
*Denotes a tie in previous year(s)
Measurable precipitation has fallen 33% of the time, with over an inch of precipitation falling on 4 different occasions, occurring as recent as 2010 when nearly 3 inches soaked the city. There have been 2 Thanksgivings that measurable snow has fallen, with the most back in 1950 when 1.8 inches accumulated.
| Wettest | Snowiest |
| 2.99 in 2010 | 1.8 in 1950 |
| 1.41 in 1925 | 0.3 in 1980 |
| 1.37 in 1979 | |
| 1.35 in 1968 | |
| 0.99 in 1928 |
Here is a look at the observed weather for the past 15 years:
| Recent Weather for Thanksgiving | |||
| Year | High | Low | Precip |
| 2010 | 67 | 32 | 2.99 |
| 2011 | 49 | 38 | 0 |
| 2012 | 65 | 33 | 0 |
| 2013 | 42 | 17 | 0 |
| 2014 | 34 | 22 | 0.02 |
| 2015 | 70 | 53 | T |
| 2016 | 54 | 44 | 0.01 |
| 2017 | 49 | 25 | 0 |
| 2018 | 59 | 28 | 0 |
| 2019 | 41 | 33 | 0.02 |
| 2020 | 51 | 48 | 0 |
| 2021 | 55 | 29 | 0.45 |
| 2022 | 56 | 32 | 0.01 |
| 2023 | 57 | 32 | 0 |
| 2024 | 42 | 32 | 0 |
*Climate Data has been recorded at Cape Girardeau Regional Airport, located 5 miles southwest of Cape Girardeau, since June of 1960.
While Thanksgiving has been celebrated unofficially in the United States for many years, it was on October 3, 1863 that President Abraham Lincoln offically declared the last Thursday of November as Thanksgiving Day. In 1941, Congress moved the date to the fourth Thursday of November (effective in 1942), in part to clear confusion caused by a Proclamation issued by President Franklin D. Roosevelt, which had moved Thanksgiving to the 3rd Thursday in November in 1939-1941. For climate purposes, anytime from November 20th - 30th will be used depending on the the date the holiday was observed for a given year. Since 1942, Thanksgiving has always fallen between November 22nd - 28th.
Here is a look at high and low temperature frequencies and extremes as well as precipitation statistics for Thanksgiving in Cape Girardeau.
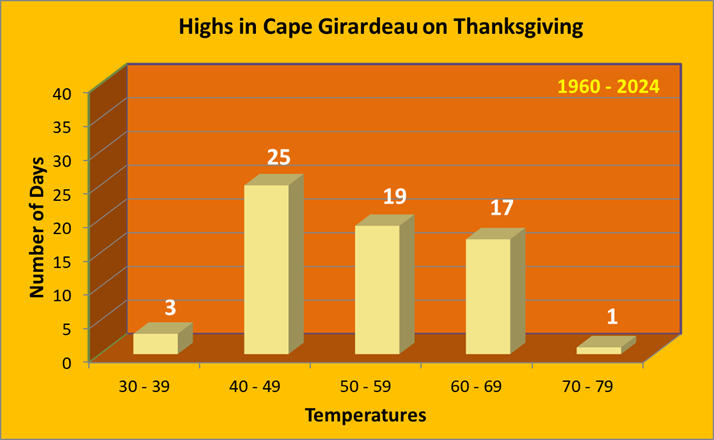
As seen by this graphic high temperatures in the 40s are most common (40% of all years), but 50s and 60s happen in rather high frequency as well.
| Warmest Highs | Coldest Highs |
| 72 in 1981 | 34 in 1980 |
| 69 in 1973 | 35 in 1975 |
| 69 in 1966 | 38 in 2014 |
| 68 in 1965 | 40 in 2019 |
| 67 in 2010 | 40 in 2007 |
| 67 in 1998 | 40 in 1971 |
| 65 in 2015 | |
| Normal High: | 51 - 54 |
Cape Girardeau has hit 70 degrees once but it hasn't happened since 1981. There have been 3 years where the high temperature failed to reach 40 degrees, and it occurred as recently as 2014 with a reading of a chilly 38 degrees.
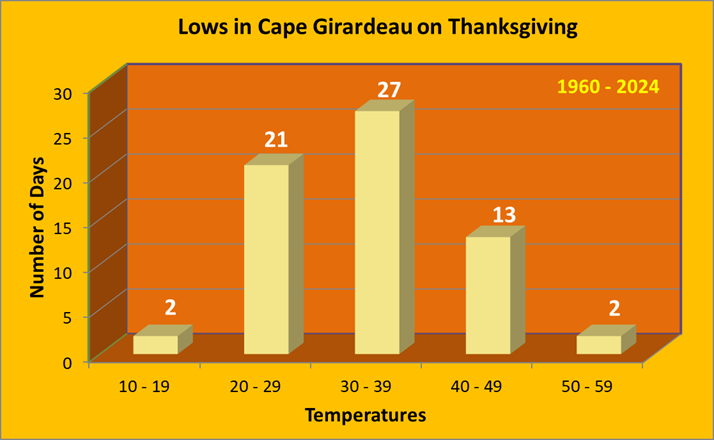
Low temperatures typically fall in the 20s or 30s, accounting for 73% of the years on record. There have been 2 years where the low dipped into the teens, in 2013 and 2002. On the warm side of the spectrum, there has been 2 years where the low was held above 50 degrees, in 2015 and 1991.
| Warmest Lows | Coldest Lows |
| 53 in 2015 | 19 in 2013 |
| 51 in 1991 | 19 in 2002 |
| 49 in 1978 | 22 in 2017 |
| 49 in 1966 | 22 in 1996 |
| 45 in 2011 | 23 in 1997 |
| 45 in 1981 | 23 in 1984 |
| 45 in 1965 | 23 in 1975 |
| Normal Low: | 32 - 34 |
Measurable precipitation has fallen 29% of the time, with an inch or more of precipitation occurring only once, back in 2010.
| Wettest |
| 2.43 in 2010 |
| 0.98 in 1968 |
| 0.89 in 1993 |
| 0.86 in 1990 |
| 0.64 in 2003 |
| 0.64 in 1979 |
Here is a look at the observed weather for the past 15 years:
| Recent Weather for Thanksgiving | |||
| Year | High | Low | Precip |
| 2010 | 67 | 31 | 2.43 |
| 2011 | 48 | 45 | 0 |
| 2012 | 63 | 34 | T |
| 2013 | 42 | 19 | 0 |
| 2014 | 38 | 27 | 0 |
| 2015 | 65 | 53 | T |
| 2016 | 49 | 44 | 0 |
| 2017 | 51 | 22 | 0 |
| 2018 | 61 | 27 | 0 |
| 2019 | 40 | 34 | 0.25 |
| 2020 | 51 | 37 | 0 |
| 2021 | 55 | 29 | 0.54 |
| 2022 | 51 | 41 | 0.22 |
| 2023 | 59 | 27 | 0 |
| 2024 | 44 | 31 | 0 |
Climate Data has been recorded at the Poplar Bluff Airport, located 4 miles east of Poplar Bluff, since December of 1997. Prior to that data was taken at the Poplar Bluff COOP station, located a half mile west of downtown. Data for the COOP station dates back to January 1893.
While Thanksgiving has been celebrated unofficially in the United States for many years, it was on October 3, 1863 that President Abraham Lincoln offically declared the last Thursday of November as Thanksgiving Day. In 1941, Congress moved the date to the fourth Thursday of November (effective in 1942), in part to clear confusion caused by a Proclamation issued by President Franklin D. Roosevelt, which had moved Thanksgiving to the 3rd Thursday in November in 1939-1941. For climate purposes, anytime from November 20th - 30th will be used depending on the the date the holiday was observed for a given year. Since 1942, Thanksgiving has always fallen between November 22nd - 28th.
Here is a look at high and low temperature frequencies and extremes as well as precipitation statistics for Thanksgiving in Poplar Bluff.
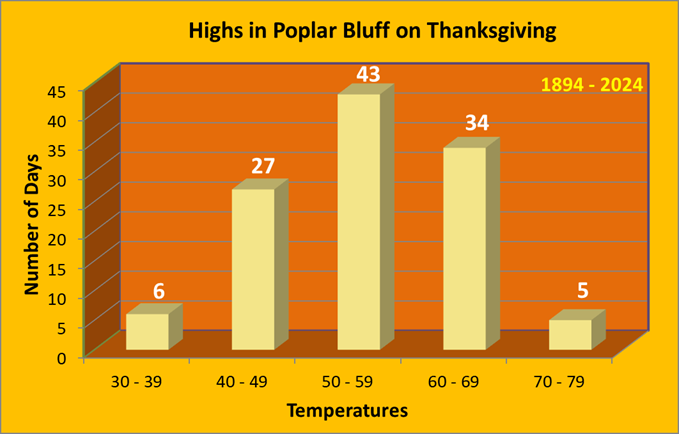
As seen by this graphic high temperatures are predominately in the 40s or 50s on Thanksgiving, encompassing 67% of all years on record.
| Warmest Highs | Coldest Highs |
| 75 in 1933 | 30 in 1975 |
| 75 in 1899 | 34 in 1958 |
| 74 in 1987 | 38 in 1982 |
| 71 in 1926 | 38 in 1936 |
| 70 in 1990 | 39 in 2019* |
| Normal High: | 52 - 55 |
Poplar Bluff has cracked 70 degrees five times on Thanksgiving, most recently back in 1990. Meanwhile, there have also been 6 years where the high temperature failed to reach 40 degrees. This last occurred in 2019.
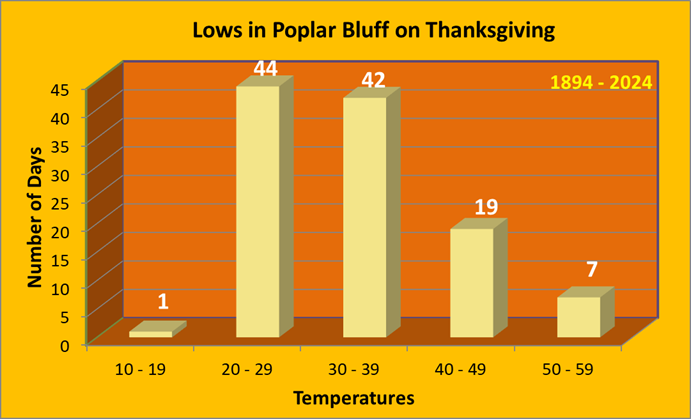
Low temperatures typically fall into the 20s or 30s, accounting for 76% of the years on record. The coldest low occurred back in 1975 when the low dropped to 12 degrees, which is the only year with lows in the teens. On the warm end of the spectrum, lows have remained in the 50s on seven occasions, most recently in 2015.
| Warmest Lows | Coldest Lows |
| 56 in 1915 | 12 in 1975 |
| 56 in 1896 | 21 in 2013 |
| 55 in 1933 | 21 in 1970 |
| 53 in 1940 | 21 in 1920 |
| 50 in 2015* | 22 in 2002* |
| Normal Low: | 34 - 35 |
*Denotes a tie in previous year(s)
Measurable precipitation has fallen 28% of the time, with over an inch of precipitation falling on 5 different occasions, occurring as recent as 2010.
| Wettest |
| 2.06 in 2010 |
| 2.00 in 1968 |
| 1.81 in 1961 |
| 1.35 in 1918 |
| 1.15 in 1980 |
Here is a look at the observed weather for the past 15 years:
| Recent Weather for Thanksgiving | |||
| Year | High | Low | Precip |
| 2010 | 68 | 32 | 2.06 |
| 2011 | 51 | 43 | 0 |
| 2012 | 65 | 36 | T |
| 2013 | 45 | 21 | 0 |
| 2014 | 43 | 28 | T |
| 2015 | 64 | 50 | 0.01 |
| 2016 | 49 | 44 | 0 |
| 2017 | 52 | 24 | 0 |
| 2018 | 61 | 27 | 0 |
| 2019 | 39 | 37 | 0.34 |
| 2020 | 54 | 40 | 0 |
| 2021 | 57 | 28 | 0.44 |
| 2022 | 51 | 42 | 0.66 |
| 2023 | 58 | 28 | 0 |
| 2024 | 48 | 30 | 0 |
Climate Data has been recorded at Southern Illinois Airport, located 4 miles northwest of Carbondale, since August of 1998. Prior to that data was taken at the Carbondale Sewage Plant COOP station, located 3 miles east of Carbondale. Data for the COOP station dates back to November 1898.
While Thanksgiving has been celebrated unofficially in the United States for many years, it was on October 3, 1863 that President Abraham Lincoln offically declared the last Thursday of November as Thanksgiving Day. In 1941, Congress moved the date to the fourth Thursday of November (effective in 1942), in part to clear confusion caused by a Proclamation issued by President Franklin D. Roosevelt, which had moved Thanksgiving to the 3rd Thursday in November in 1939-1941. For climate purposes, anytime from November 20th - 30th will be used depending on the the date the holiday was observed for a given year. Since 1942, Thanksgiving has always fallen between November 22nd - 28th.
Here is a look at high and low temperature frequencies and extremes as well as precipitation statistics for Thanksgiving in Carbondale.

As seen by this graphic high temperatures are predominately in the 30s, 40s, or 50s on Thanksgiving, encompassing 85% of all years on record.
| Warmest Highs | Coldest Highs |
| 72 in 1966 | 32 in 1958 |
| 72 in 1915 | 34 in 2014 |
| 72 in 1910 | 34 in 1936 |
| 71 in 1990 | 35 in 1982 |
| 69 in 1899 | 37 in 1975* |
| Normal High: | 51 - 53 |
Carbondale has cracked 70 degrees four times on Thanksgiving, most recently back in 1990. Meanwhile there have been 13 years where the high temperature failed to reach 40 degrees. This last occurred back in 2019.

Low temperatures typically fall into the 20s or 30s, accounting for 67% of the years on record. There was one year that lows dipped into the single digits, way back in 1903 when the low dropped to a frigid 5 degrees. On the warm end of the spectrum, lows have remained in the 50s eight times, most recently in 2015.
| Warmest Lows | Coldest Lows |
| 57 in 1933 | 5 in 1950 |
| 56 in 2015 | 15 in 1982 |
| 55 in 1915 | 15 in 1898 |
| 52 in 1966 | 16 in 2013 |
| 52 in 1913 | 17 in 1945* |
| Normal Low: | 32 - 33 |
*Denotes a tie in previous year(s)
Measurable precipitation has fallen 30% of the time, with over an inch of precipitation falling on 6 different occasions, occurring as recent as 2010.
| Wettest |
| 2.25 in 2010 |
| 1.39 in 1968 |
| 1.34 in 1961 |
| 1.26 in 1979 |
| 1.24 in 1921 |
Here is a look at the observed weather for the past 15 years:
| Recent Weather for Thanksgiving | |||
| Year | High | Low | Precip |
| 2010 | 67 | 29 | 2.25 |
| 2011 | 50 | 43 | 0 |
| 2012 | 66 | 32 | 0.07 |
| 2013 | 44 | 16 | 0 |
| 2014 | 34 | 22 | 0.02 |
| 2015 | 65 | 56 | 0 |
| 2016 | 45 | 42 | 0 |
| 2017 | 52 | 21 | 0 |
| 2018 | 62 | 27 | 0 |
| 2019 | 38 | 31 | 0.02 |
| 2020 | 50 | 37 | 0 |
| 2021 | 56 | 25 | 0.17 |
| 2022 | 50 | 35 | 0.12 |
| 2023 | 60 | 27 | 0 |
| 2024 | 40 | 30 | T |

