*Climate Data has been recorded at Barkley Regional Airport in West Paducah since 1949 and prior to that was observed in downtown Paducah back to December of 1937.
Saint Patrick's Day is celebrated on March 17th every year.
Here is a look at high and low temperature frequencies and extremes as well as precipitation statistics for St. Patrick's Day in Paducah.
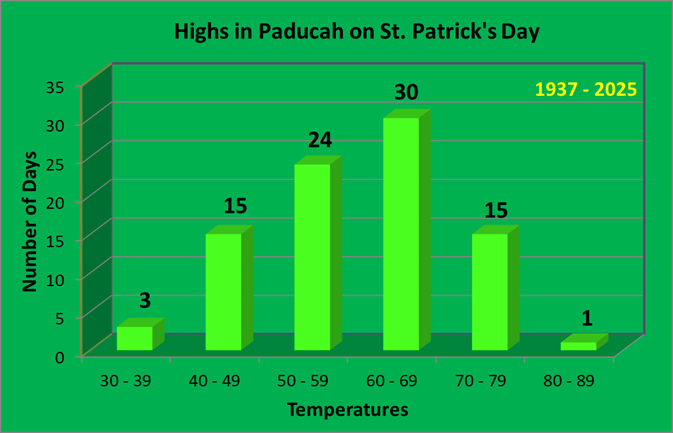
As seen by this graphic, high temperatures typically rise into the 50s or 60s, accounting for 59% of all years on record.
| Warmest Highs | Coldest Highs |
| 83 in 1945 | 34 in 1960 |
| 79 in 1989 | 37 in 1970 |
| 77 in 2012 | 37 in 1958 |
| 77 in 2011 | 40 in 1947 |
| 77 in 1942 | 42 in 2007* |
| Normal High: | 59 |
*Denotes a tie in previous year(s)
Paducah has seen highs surge above 80 degrees only once on St. Patricks Day, way back in 1945. There have also been 3 years where the high temperature failed to reach 40 degrees. This last occurred in 1970 when the high only made it up to 37 degrees!
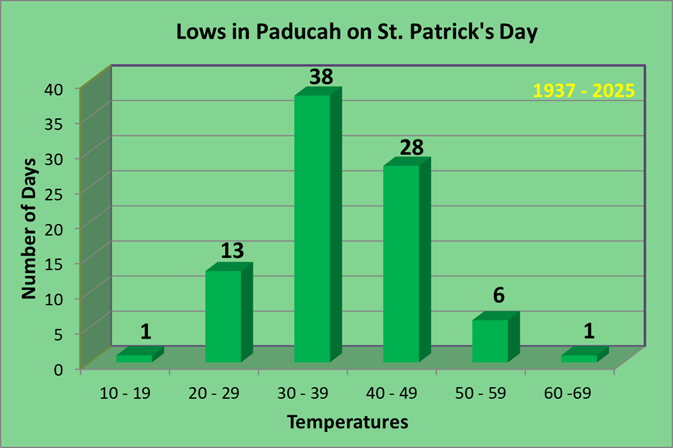
Low temperatures typically fall in the 30s or 40s, accounting for 73% of all years on record. There are always exceptions to the norm of course: in 1941 the low temperature dropped to a frigid 19 degrees, which is the only year that lows have tumbled into the teens. There have been 7 years with lows above 50 degrees, most recently in 2012.
| Warmest Lows | Coldest Lows |
| 65 in 1945 | 19 in 1941 |
| 56 in 2012 | 20 in 1962 |
| 55 in 1982 | 24 in 1971 |
| 54 in 1946 | 24 in 1967 |
| 51 in 1966 | 24 in 1960 |
| Normal Low: | 38 |
Measurable precipitation has fallen 34% of the time, with over an inch of precipitation falling on 5 different occasions, the most recent being in 2021. Measurable snowfall has only occurred on 3 occasions (4% of all years on record), with the most recent back in 1988. There have been 2 years (3% of all years on record) with a snow depth of 1 inch or greater. This last happened on St. Patrick's Day back in 1970 when there was a 6 inch snowpack in place.
| Wettest (inches) | Snowiest (inches) | Most Snow Depth |
| 1.60 in 1945 | 5.0 in 1970 | 6.0 in 1970 |
| 1.33 in 2021 | 2.0 in 1958 | 1.0 in 1960 |
| 1.33 in 1951 | 1.0 in 1988 | |
| 1.29 in 1980 | ||
| 1.25 in 1970 |
Here is a look at the observed weather for the past 15 years:
| Recent St. Patrick's Day Weather | |||
| Year | High | Low | Precip |
| 2011 | 77 | 50 | 0 |
| 2012 | 77 | 56 | T |
| 2013 | 44 | 38 | 0.79 |
| 2014 | 48 | 30 | 0 |
| 2015 | 62 | 44 | 0 |
| 2016 | 67 | 39 | 0 |
| 2017 | 60 | 46 | 0.11 |
| 2018 | 71 | 45 | 0.01 |
| 2019 | 60 | 32 | 0 |
| 2020 | 61 | 45 | 0.22 |
| 2021 | 61 | 48 | 1.33 |
| 2022 | 73 | 43 | 0 |
| 2023 | 57 | 34 | 0.08 |
| 2024 | 58 | 39 | 0 |
| 2025 | 63 | 29 | 0 |
*Climate Data has been recorded at Evansville Regional Airport since January of 1897. Snowfall records began in January of 1948.
Saint Patrick's Day is celebrated on March 17th every year.
Here is a look at high and low temperature frequencies and extremes as well as precipitation statistics for St. Patrick's Day in Evansville.
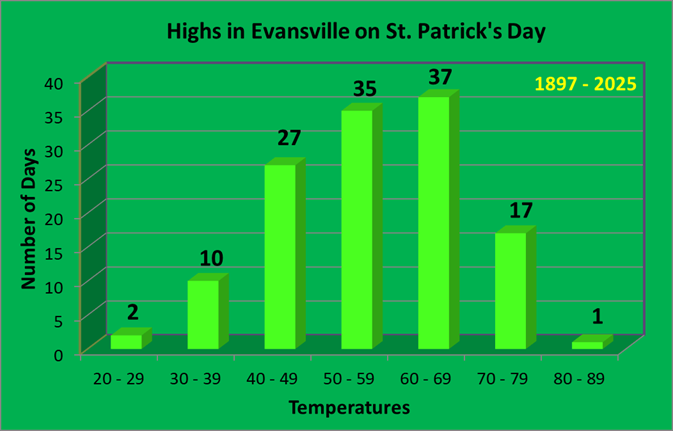
As seen by this graphic, high temperatures typically rise into the 40s, 50s, or 60s, accounting for 76% of all years on record.
| Warmest Highs | Coldest Highs |
| 80 in 2012 | 28 in 1906 |
| 79 in 1989 | 29 in 1941 |
| 76 in 2011 | 33 in 1958 |
| 76 in 1995 | 34 in 1960 |
| 76 in 1903 | 35 in 1902 |
| Normal High: | 57 |
Evansville has seen highs surge to 80 degrees only once on St. Patricks Day, back in 2012. There have also been 12 years where the high temperature failed to reach 40 degrees. This hasn't happened since 1978 when the high only made it up to 39 degrees.
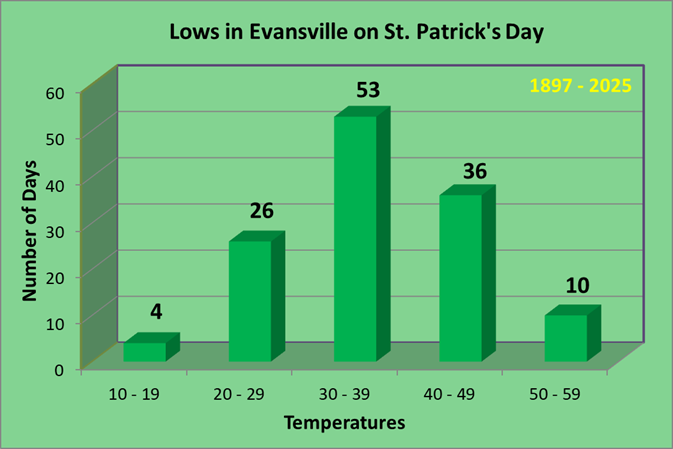
Low temperatures fall into the 30s a decent chunk of the time, accounting for 41% of all years on record. 20s and 40s are also fairly common for lows.There are always exceptions to the norm of course: in 1900 the low temperature dropped to a frigid 13 degrees, which is 1 of only 4 years that lows have tumbled into the teens. There have been 10 years with lows above 50 degrees, most recently in 2012.
| Warmest Lows | Coldest Lows |
| 59 in 1903 | 13 in 1900 |
| 54 in 1946 | 15 in 1941 |
| 54 in 1945 | 16 in 1906 |
| 54 in 1927 | 16 in 1902 |
| 54 in 1905 | 23 in 1976* |
| Normal Low: | 36 |
*Denotes a tie in previous year(s)
Measurable precipitation has fallen 34% of the time, with over an inch of precipitation falling on 4 different occasions, the most recent being in 2013. Measurable snowfall has only occurred on 5 occasions (7% of all years on record), with the most recent back in 1988. There has only been 1 year (1% of all years on record) with a snow depth of 1 inch or greater. This happened back in 1960 when there was 4 inches of snow on the ground for St. Patrick's Day.
| Wettest (inches) | Snowiest (inches) | Most Snow Depth |
| 2.92 in 1951 | 8.3 in 1970 | 4.0 in 1960 |
| 1.97 in 2013 | 1.5 in 1949 | |
| 1.49 in 1970 | 0.8 in 1958 | |
| 1.18 in 1949 | 0.4 in 1988 | |
| 0.88 in 1898 | 0.3 in 1978 |
Here is a look at the observed weather for the past 15 years:
| Recent St. Patrick's Day Weather | |||
| Year | High | Low | Precip |
| 2010 | 62 | 41 | 0 |
| 2011 | 76 | 44 | 0 |
| 2012 | 80 | 53 | 0.01 |
| 2013 | 40 | 36 | 1.97 |
| 2014 | 43 | 28 | 0 |
| 2015 | 61 | 39 | 0 |
| 2016 | 65 | 42 | 0 |
| 2017 | 54 | 43 | 0.22 |
| 2018 | 63 | 38 | 0.13 |
| 2019 | 56 | 30 | 0 |
| 2020 | 56 | 40 | 0.04 |
| 2021 | 63 | 44 | 0.34 |
| 2022 | 73 | 43 | 0 |
| 2023 | 55 | 30 | 0.08 |
| 2024 | 53 | 33 | 0 |
| 2025 | 55 | 27 | 0 |
*Climate Data has been recorded at Cape Girardeau Regional Airport, located 5 miles southwest of Cape Girardeau, since June of 1960.
Saint Patrick's Day is celebrated on March 17th every year.
Here is a look at high and low temperature frequencies and extremes as well as precipitation statistics for St. Patrick's Day in Cape Girardeau.
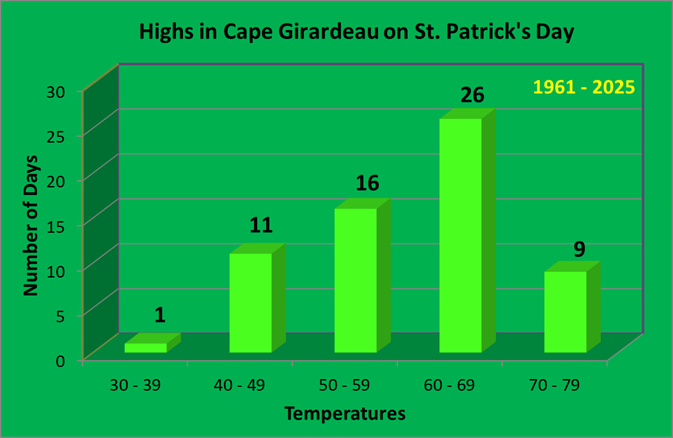
As seen by this graphic, high temperatures typically rise into the 50s or 60s, accounting for 63% of all years on record.
| Warmest Highs | Coldest Highs |
| 77 in 1995 | 37 in 1970 |
| 77 in 1989 | 40 in 2007 |
| 76 in 2012 | 42 in 1988 |
| 75 in 1963 | 43 in 2013 |
| 73 in 2022 | 44 in 1993* |
| Normal High: | 59 |
*Denotes a tie in previous year(s)
Cape Girardeau has seen highs surge into the 70s 9 times on St. Patrick's Day, most recently back in 2022. There has also been 1 year where the high temperature failed to reach 40 degrees. This occurred back in 1970 when the high topped out at a chilly 37 degrees!
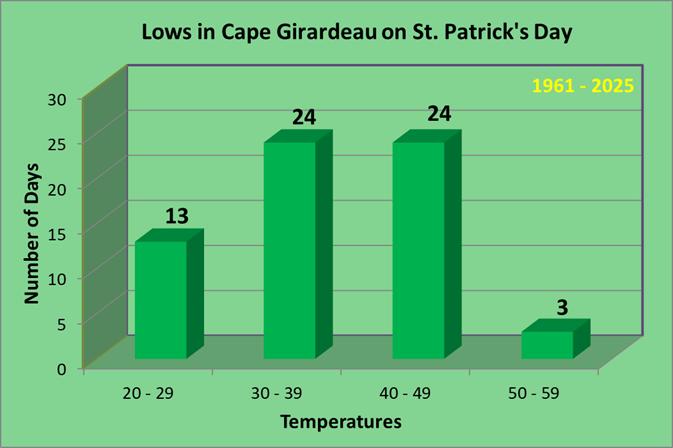
Low temperatures typically fall into the 30s or 40s for lows, accounting for 75% of all years on record. There are always exceptions to the norm of course: back in 1967 and 1962 the low dropped to 22 degrees. There have also been 3 years with lows above 50 degrees, in 2021, 2012 and 1982.
| Warmest Lows | Coldest Lows |
| 56 in 2012 | 22 in 1967 |
| 51 in 1982 | 22 in 1962 |
| 50 in 2021 | 24 in 2005 |
| 49 in 1983 | 25 in 1976 |
| 48 in 1991 | 25 in 1969 |
| Normal Low: | 36 |
*Denotes a tie in previous year(s)
Measurable precipitation has fallen 26% of the time, with over an inch of precipitation falling on 5 different occasions, the most recent being in 2021.
| Wettest |
| 1.96 in 2021 |
| 1.21 in 1970 |
| 1.13 in 2013 |
| 1.08 in 1984 |
| 1.02 in 1987 |
Here is a look at the observed weather for the past 15 years:
| Recent St. Patrick's Day Weather | |||
| Year | High | Low | Precip |
| 2011 | 72 | 45 | 0 |
| 2012 | 76 | 56 | 0 |
| 2013 | 43 | 36 | 1.13 |
| 2014 | 47 | 28 | 0 |
| 2015 | 59 | 44 | 0 |
| 2016 | 67 | 41 | 0 |
| 2017 | 60 | 43 | 0.02 |
| 2018 | 69 | 45 | 0 |
| 2019 | 60 | 32 | 0 |
| 2020 | 60 | 44 | 0.10 |
| 2021 | 62 | 50 | 1.96 |
| 2022 | 73 | 40 | 0 |
| 2023 | 56 | 32 | 0.16 |
| 2024 | 59 | 37 | 0 |
| 2025 | 62 | 27 | 0 |
Climate Data has been recorded at the Poplar Bluff Airport, located 4 miles east of Poplar Bluff, since December of 1997. Prior to that data was taken at the Poplar Bluff COOP station, located a half mile west of downtown. Data for the COOP station dates back to January 1893.
Saint Patrick's Day is celebrated on March 17th every year.
Here is a look at high and low temperature frequencies and extremes as well as precipitation statistics for St. Patrick's Day in Poplar Bluff.
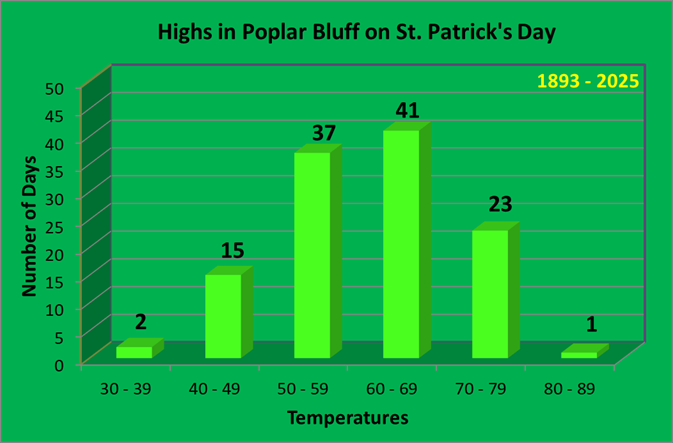
As seen by this graphic, high temperatures typically rise into the 50s or 60s, accounting for 65% of all years on record.
| Warmest Highs | Coldest Highs |
| 85 in 1982 | 38 in 1893 |
| 79 in 1903 | 39 in 2007 |
| 78 in 1995 | 41 in 1949 |
| 78 in 1894 | 41 in 1941 |
| 77 in 2012* | 43 in 1960 |
| Normal High: | 59 |
*Denotes a tie in previous year(s)
Poplar Bluff has seen highs surge above 80 degrees on 1 occasion, back in 1982 when the temperature reached 85. There has also been 2 years where the high temperature failed to reach 40 degrees. This occurred back in 2007 and 1893.
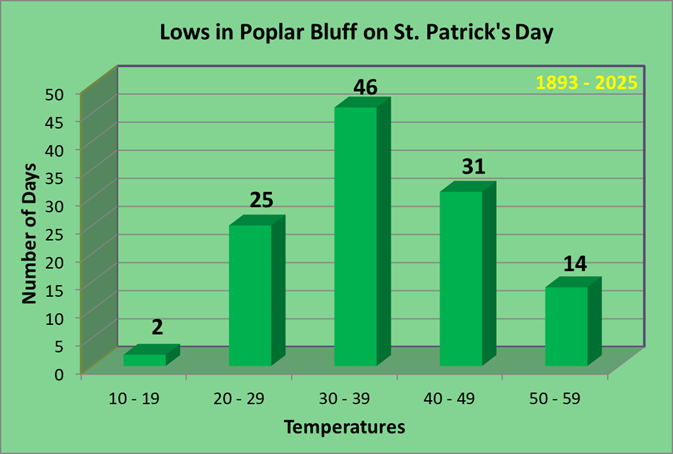
Low temperatures typically fall into the 30s or 40s for lows, accounting for 64% of all years on record. There are always exceptions to the norm of course: back in 1941 and 1895 the low dropped to 19 degrees. Meanwhile, there have been 14 years with lows above 50 degrees, most recently in 2021.
| Warmest Lows | Coldest Lows |
| 57 in 2012 | 19 in 1941 |
| 57 in 1894 | 19 in 1895 |
| 56 in 1965 | 22 in 1969 |
| 55 in 2003 | 23 in 1962 |
| 54 in 1934* | 23 in 1937 |
| Normal Low: | 39 |
*Denotes a tie in previous year(s)
Measurable precipitation has fallen 27% of the time, with over an inch of precipitation falling on 5 different occasions, the most recent being in 2021.
| Wettest |
| 2.14 in 1897 |
| 1.45 in 1927 |
| 1.33 in 2021 |
| 1.07 in 1963 |
| 1.01 in 1932 |
Here is a look at the observed weather for the past 15 years:
| Recent St. Patrick's Day Weather | |||
| Year | High | Low | Precip |
| 2011 | 73 | 45 | 0 |
| 2012 | 77 | 57 | 0 |
| 2013 | 45 | 39 | 0.78 |
| 2014 | 47 | 29 | 0 |
| 2015 | 63 | 46 | 0 |
| 2016 | 63 | 40 | 0 |
| 2017 | 62 | 44 | 0.05 |
| 2018 | 68 | 44 | 0 |
| 2019 | 63 | 35 | 0 |
| 2020 | 58 | 44 | 0.22 |
| 2021 | 63 | 51 | 1.33 |
| 2022 | 75 | 42 | 0 |
| 2023 | 55 | 33 | 0.06 |
| 2024 | 63 | 40 | 0 |
| 2025 | 65 | 30 | 0 |
Climate Data has been recorded at Southern Illinois Airport, located 4 miles northwest of Carbondale, since August of 1998. Prior to that data was taken at the Carbondale Sewage Plant COOP station, located 3 miles east of Carbondale. Data for the COOP station dates back to November 1898.
Saint Patrick's Day is celebrated on March 17th every year.
Here is a look at high and low temperature frequencies and extremes as well as precipitation statistics for St. Patrick's Day in Carbondale.

As seen by this graphic, high temperatures typically rise into the 50s or 60s, accounting for 62% of all years on record.
| Warmest Highs | Coldest Highs |
| 83 in 1982 | 31 in 1941 |
| 78 in 2012 | 37 in 1970 |
| 78 in 1903 | 38 in 1960 |
| 77 in 1995 | 40 in 1949 |
| 76 in 1921 | 40 in 1928 |
| Normal High: | 57 |
*Denotes a tie in previous year(s)
Carbondale has seen highs surge above 70 degrees 15 times on St. Patrick's Day, most recently back in 2022. Only once have temperatures been above 80. Meanwhile, there have been 3 years where the high temperature failed to reach 40 degrees, most recently occurring back in 1970.

Low temperatures typically fall into the 20s or 30s for lows, accounting for 68% of all years on record. There are always exceptions to the norm of course: back in 1900 the low plummeted to 3 degrees, the only year with lows in the single digits. There have also been 8 years with lows above 50 degrees, most recently in 2012.
| Warmest Lows | Coldest Lows |
| 58 in 1945 | 3 in 1900 |
| 55 in 1927 | 17 in 1941 |
| 54 in 2012 | 20 in 1962 |
| 54 in 1963 | 22 in 1976 |
| 52 in 1946 | 23 in 1988* |
| Normal Low: | 36 |
*Denotes a tie in previous year(s)
Measurable precipitation has fallen 25% of the time, with over an inch of precipitation falling on 6 different occasions, the most recent being in 2021.
| Wettest |
| 2.50 in 2013 |
| 1.90 in 2021 |
| 1.59 in 1932 |
| 1.57 in 1980 |
| 1.26 in 1963 |
Here is a look at the observed weather for the past 15 years:
| Recent St. Patrick's Day Weather | |||
| Year | High | Low | Precip |
| 2011 | 73 | 47 | 0 |
| 2012 | 78 | 54 | 0.18 |
| 2013 | 41 | 34 | 2.50 |
| 2014 | 45 | 27 | 0 |
| 2015 | 61 | 40 | 0 |
| 2016 | 65 | 39 | 0 |
| 2017 | 59 | 45 | T |
| 2018 | 61 | 40 | 0 |
| 2019 | 53 | 33 | 0 |
| 2020 | 54 | 42 | T |
| 2021 | 61 | 44 | 1.90 |
| 2022 | 74 | 42 | 0 |
| 2023 | 54 | 31 | 0.04 |
| 2024 | 55 | 32 | 0 |
| 2025 | 62 | 27 | 0 |

