*Climate Data has been recorded at Barkley Regional Airport in West Paducah since 1949 and prior to that was observed in downtown Paducah back to December of 1937.
Here is a look at high and low temperature frequencies and extremes as well as precipitation statistics for New Year's Day in Paducah.
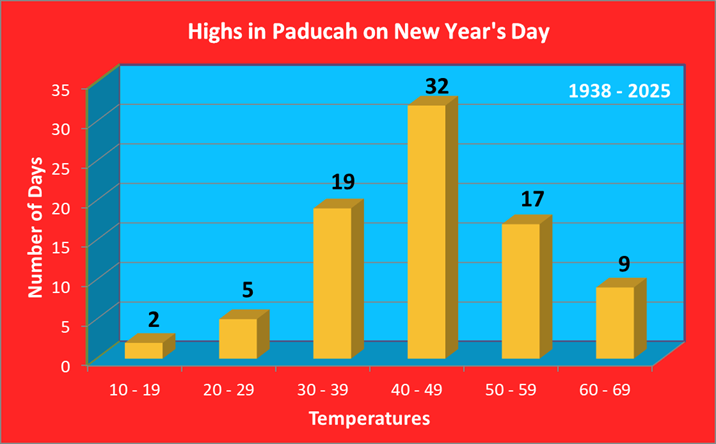
As seen by this graphic, high temperatures usually are in the 30s(26% of yrs), 40s(36% of yrs), or 50s(20% of yrs) on New Years Day.
| Warmest Highs | Coldest Highs |
| 69 in 1965 | 15 in 1974 |
| 68 in 1952 | 17 in 2018 |
| 66 in 2006 | 21 in 2001 |
| 66 in 2005 | 22 in 1968 |
| 66 in 1985 | 27 in 1977 |
| Normal High: | 43 |
*Denotes a tie in previous year(s)
Paducah has seen highs as warm as the 60s 9 times, most recently in 2023, when we topped out at 65 degrees to ring in the New Year. There has also been 7 years where the high temperature failed to reach 30 degrees. This last occurred in 2018 when the high only made it up to 17 degrees!
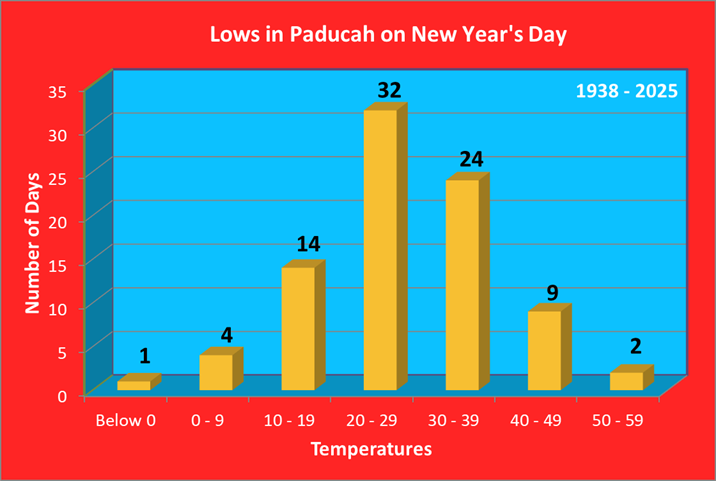
Low temperatures typically fall in the 20s or 30s, accounting for 66% of all years on record. There are always exceptions to the norm of course: in 1992 the low temperature dropped to -2, which is the only New Year's with lows below 0. There have been 2 years with lows in the 50s, in 2005 and 1966.
| Warmest Lows | Coldest Lows |
| 56 in 2005 | -2 in 1968 |
| 52 in 1966 | 3 in 2018 |
| 48 in 1950 | 4 in 1977 |
| 46 in 1997 | 7 in 2001 |
| 45 in 2023* | 7 in 1974 |
| Normal Low: | 26 |
*Denotes a tie in previous year(s)
Measurable precipitation has fallen 39% of the time, with over an inch of precipitation falling on 5 different occasions, most recently in 2022. Measurable snowfall has only occurred on 5 occasions (7% of all years on record), with the most recent back in 2001. There have been 5 years (7% of all years on record) with a snow depth of 1 inch or greater. This last happened in 2001 when there was 1 inch of snow on the ground to ring in the New Year.
| Wettest (inches) | Snowiest (inches) | Most Snow Depth |
| 3.40 in 1966 | 1.5 in 1947 | 4.0 in 1940 |
| 2.46 in 2022 | 1.0 in 1940 | 2.0 in 1961 |
| 1.80 in 1948 | 0.8 in 2001 | 2.0 in 1947 |
| 1.67 in 1952 | 0.5 in 1979 | 1.0 in 2001 |
| 1.42 in 1942 | 0.2 in 1987 | 1.0 in 1968 |
Here is a look at the observed weather for the past 15 years:
| Recent New Year's Weather | |||||
| Year | High | Low | Precip | Snowfall | Snow Depth |
| 2011 | 53 | 23 | 0.35 | 0 | 0 |
| 2012 | 59 | 36 | 0 | 0 | 0 |
| 2013 | 37 | 22 | T | T | 0 |
| 2014 | 49 | 28 | 0.02 | 0 | 0 |
| 2015 | 39 | 21 | 0.01 | 0 | 0 |
| 2016 | 44 | 26 | 0 | 0 | 0 |
| 2017 | 47 | 41 | 0.01 | 0 | 0 |
| 2018 | 17 | 3 | 0 | 0 | 0 |
| 2019 | 47 | 39 | 0 | 0 | 0 |
| 2020 | 55 | 31 | 0 | 0 | 0 |
| 2021 | 56 | 35 | 0.73 | 0 | 0 |
| 2022 | 65 | 42 | 2.46 | 0 | 0 |
| 2023 | 61 | 45 | 0 | 0 | 0 |
| 2024 | 40 | 36 | 0 | 0 | 0 |
| 2025 | 43 | 28 | 0 | 0 | 0 |
*Climate Data has been recorded at Evansville Regional Airport since January of 1897. Snowfall records began in January of 1948.
Here is a look at high and low temperature frequencies and extremes as well as precipitation statistics for New Year's Day in Evansville.
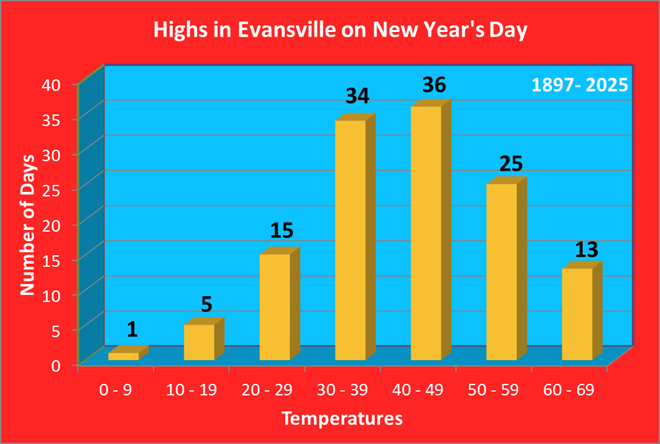
As seen by this graphic, high temperatures usually are in the 30s or 40s, accounting for 56% of all years on record.
| Warmest Highs | Coldest Highs |
| 67 in 1965 | 3 in 1928 |
| 67 in 1952 | 14 in 2018 |
| 65 in 1985 | 14 in 1974 |
| 63 in 2005 | 17 in 1940 |
| 62 in 1948* | 19 in 1977* |
| Normal High: | 41 |
*Denotes a tie in previous year(s)
Evansville has seen highs as warm as the 60s 13 times, most recently in 2022, when we topped out at 61 degrees to ring in the New Year. There have also been 6 years where the high temperature failed to reach 20 degrees. This occurred most recently in 2018 when the high was only 14 degrees. This was nothing compared to the frigid New Year's back in 1928 when the high temperature was only 3 degrees!
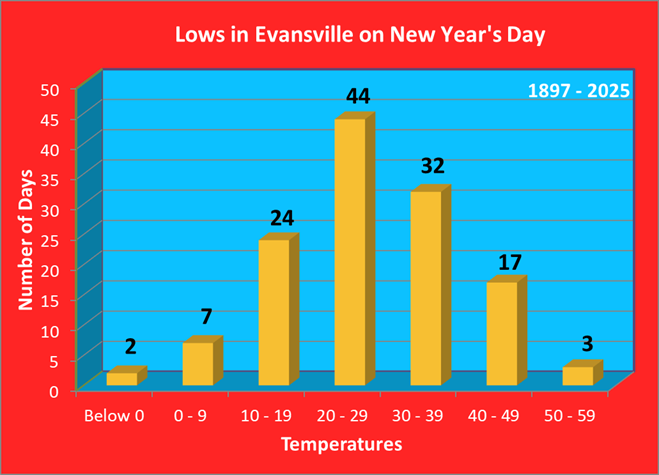
Low temperatures fall in the 20s most frequently, accounting for 36% of all years on record. Teens and 30s are fairly common lows as well. There are always exceptions to the norm of course. There have been 2 years with lows below 0, back in 1968 and 1928. On the warm side of the spectrum, there have been 3 years with lows in the 50s, most recently in 2005 with a mild reading of 55 degrees.
| Warmest Lows | Coldest Lows |
| 55 in 2005 | -5 in 1968 |
| 55 in 1897 | -3 in 1928 |
| 52 in 1930 | 1 in 2018 |
| 49 in 1916 | 1 in 1977 |
| 48 in 1966 | 5 in 1999 |
| Normal Low: | 25 |
Measurable precipitation has fallen 35% of the time, with over an inch of precipitation falling on 3 different occasions, in 2022, 1966, and 1948. Measurable snowfall has only occurred on 3 occasions (4% of all years on record), with the most recent back in 2001. There have been 8 years (12% of all years on record) with a snow depth of 1 inch or greater. This last happened in 2013 when there was 1 inch of snow on the ground to ring in the New Year.
| Wettest (inches) | Snowiest (inches) | Most Snow Depth |
| 2.22 in 2022 | 1.7 in 2001 | 4.0 in 2001 |
| 1.97 in 1966 | 0.7 in 1948 | 2.0 in 1998 |
| 1.17 in 1948 | 0.3 in 1987 | 2.0 in 1970 |
| 0.98 in 1942 | T in 2025 | 1.0 in 2013 |
| 0.73 in 2021 | T in 2010* | 1.0 in 1984* |
*Denotes a tie in previous year(s)
Here is a look at the observed weather for the past 15 years:
| Recent New Year's Weather | |||||
| Year | High | Low | Precip | Snowfall | Snow Depth |
| 2011 | 58 | 24 | 0.65 | 0 | 0 |
| 2012 | 55 | 34 | 0 | 0 | 0 |
| 2013 | 34 | 22 | 0 | 0 | 1 |
| 2014 | 46 | 30 | 0.05 | 0 | 0 |
| 2015 | 42 | 22 | 0 | 0 | 0 |
| 2016 | 42 | 26 | 0 | 0 | 0 |
| 2017 | 50 | 40 | 0.01 | 0 | 0 |
| 2018 | 14 | 1 | 0 | 0 | 0 |
| 2019 | 46 | 38 | 0 | 0 | 0 |
| 2020 | 52 | 30 | 0 | 0 | 0 |
| 2021 | 53 | 33 | 0.73 | 0 | 0 |
| 2022 | 61 | 43 | 2.22 | 0 | 0 |
| 2023 | 54 | 43 | 0 | 0 | 0 |
| 2024 | 38 | 34 | T | T | 0 |
| 2025 | 38 | 27 | T | T | 0 |
*Climate Data has been recorded at Cape Girardeau Regional Airport, located 5 miles southwest of Cape Girardeau, since June of 1960.
Here is a look at high and low temperature frequencies and extremes as well as precipitation statistics for New Year's Day in Cape Girardeau.

As seen by this graphic, high temperatures usually are in the 30s or 40s, accounting for 65% of all years on record.
| Warmest Highs | Coldest Highs |
| 65 in 2006 | 12 in 1974 |
| 65 in 1985 | 15 in 2018 |
| 64 in 2005 | 19 in 2001 |
| 63 in 2022 | 23 in 1968 |
| 63 in 2000 | 25 in 1977 |
| Normal High: | 42 |
Cape Girardeau has seen highs as warm as the 60s 6 times, most recently in 2022, when we topped out at 63 degrees to ring in the New Year. There have also been 3 years where the high temperature failed to reach 20 degrees. This last occurred in 2018 when the high only made it up to 15 degrees!
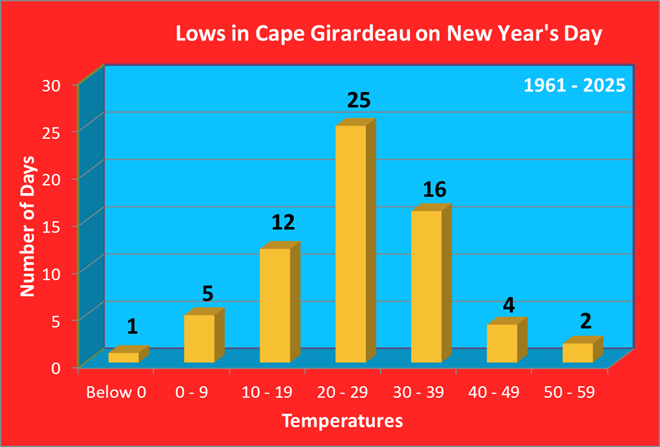
Low temperatures typically fall in the 20s (40% of the time), 30s (22% of the time), or 40s (22% of the time). There are always exceptions to the norm of course: in 2001 the low temperature dropped to -2, which is the only New Year's with lows below 0. There have been 2 years with lows in the 50s, in 2005 and 1966.
| Warmest Lows | Coldest Lows |
| 56 in 2005 | -2 in 2001 |
| 52 in 1966 | 0 in 1968 |
| 44 in 2023 | 1 in 1977 |
| 44 in 1965 | 2 in 2018 |
| 42 in 1997 | 4 in 1974 |
| Normal Low: | 24 |
Measurable precipitation has fallen 24% of the time, with over an inch of precipitation falling twice, in 2022 and 1966.
| Wettest |
| 2.02 in 2022 |
| 1.77 in 1966 |
| 0.58 in 2021 |
| 0.32 in 2005 |
| 0.20 in 1999 |
| 0.14 in 1996 |
Here is a look at the observed weather for the past 15 years:
| Recent New Year's Weather | |||
| Year | High | Low | Precip |
| 2011 | 52 | 24 | 0.01 |
| 2012 | 55 | 34 | 0 |
| 2013 | 34 | 24 | 0 |
| 2014 | 46 | 28 | T |
| 2015 | 36 | 25 | 0 |
| 2016 | 44 | 28 | 0 |
| 2017 | 46 | 40 | 0 |
| 2018 | 15 | 2 | 0 |
| 2019 | 46 | 37 | 0 |
| 2020 | 53 | 29 | 0 |
| 2021 | 48 | 33 | 0.58 |
| 2022 | 63 | 37 | 2.02 |
| 2023 | 57 | 44 | T |
| 2024 | 38 | 34 | 0 |
| 2025 | 43 | 27 | 0 |
Climate Data has been recorded at the Poplar Bluff Airport, located 4 miles east of Poplar Bluff, since December of 1997. Prior to that data was taken at the Poplar Bluff COOP station, located a half mile west of downtown. Data for the COOP station dates back to January 1893.
Here is a look at high and low temperature frequencies and extremes as well as precipitation statistics for New Year's Day in Poplar Bluff.
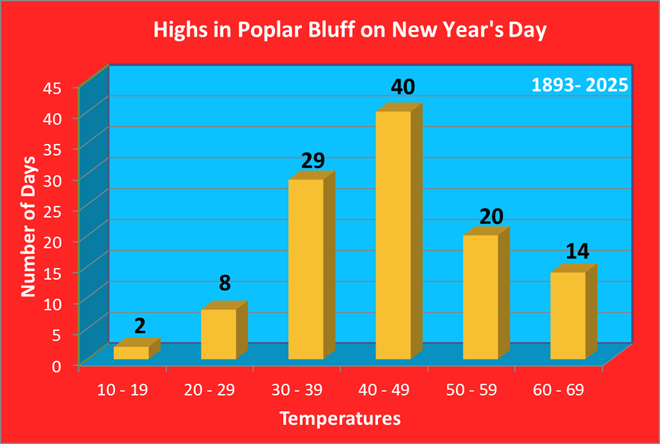
As seen by this graphic, high temperatures usually are in the 30s or 40s, accounting for 61% of all years on record.
| Warmest Highs | Coldest Highs |
| 66 in 2006 | 17 in 1928 |
| 64 in 2000 | 19 in 2018 |
| 64 in 1985 | 21 in 1977 |
| 64 in 1943 | 23 in 2001 |
| 63 in 1966* | 24 in 1974 |
| Normal High: | 44 |
Carbondale has seen highs above 60 degrees 14 times, most recently in 2022, when we topped out at 61 degrees to ring in the New Year. There have also been 2 years where the high temperature failed to reach 20 degrees. This last occurred in 2018 when the high only made it up to 19 degrees!
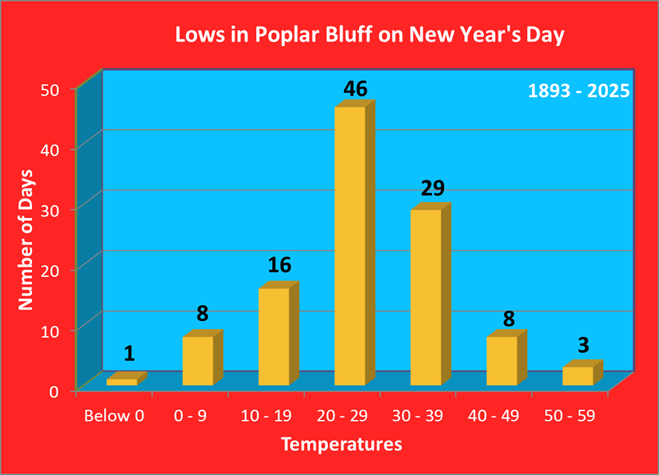
Low temperatures typically fall in the 20s (42% of the time) or 30s (25% of the time). There are always exceptions to the norm of course: in 1928 the low temperature dropped to -2, which is the only New Year's with lows below 0. There have been 3 years with lows in the 50s, most recently in 2005.
| Warmest Lows | Coldest Lows |
| 55 in 2005 | -2 in 1928 |
| 53 in 1966 | 2 in 1977 |
| 52 in 1897 | 4 in 2018 |
| 48 in 1950 | 4 in 1974 |
| 46 in 2023 | 4 in 1968 |
| 46 in 1930 | |
| Normal Low: | 26 |
Measurable precipitation has fallen 31% of the time, with over an inch of precipitation falling six times, most recently in 2022.
| Wettest |
| 2.49 in 2022 |
| 2.03 in 1966 |
| 1.70 in 1948 |
| 1.67 in 1942 |
| 1.30 in 1916 |
Here is a look at the observed weather for the past 15 years:
| Recent New Year's Weather | |||
| Year | High | Low | Precip |
| 2011 | 52 | 24 | 0 |
| 2012 | 55 | 38 | 0 |
| 2013 | 37 | 27 | T |
| 2014 | 48 | 24 | 0.03 |
| 2015 | 38 | 25 | 0.01 |
| 2016 | 45 | 28 | 0 |
| 2017 | 44 | 40 | 0 |
| 2018 | 19 | 4 | 0 |
| 2019 | 44 | 38 | 0 |
| 2020 | 53 | 30 | 0 |
| 2021 | 46 | 32 | 0.85 |
| 2022 | 61 | 36 | 2.49 |
| 2023 | 57 | 46 | 0 |
| 2024 | 37 | 33 | 0 |
| 2025 | 45 | 29 | 0 |
Climate Data has been recorded at Southern Illinois Airport, located 4 miles northwest of Carbondale, since August of 1998. Prior to that data was taken at the Carbondale Sewage Plant COOP station, located 3 miles east of Carbondale. Data for the COOP station dates back to November 1898.
Here is a look at high and low temperature frequencies and extremes as well as precipitation statistics for New Year's Day in Carbondale.
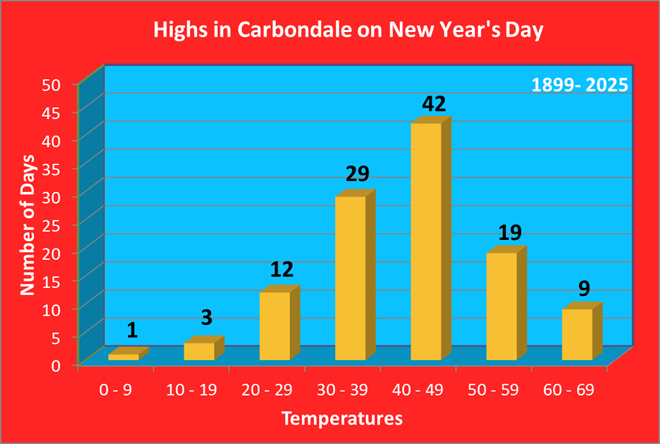
As seen by this graphic, high temperatures usually are in the 30s or 40s, accounting for 62% of all years on record.
| Warmest Highs | Coldest Highs |
| 70 in 1952 | 4 in 1928 |
| 67 in 2006 | 12 in 1977 |
| 65 in 2000 | 13 in 2018 |
| 65 in 1916 | 17 in 2001 |
| 64 in 1921 | 21 in 1974* |
| Normal High: | 42 |
Carbondale has seen highs above 60 degrees 10 times, most recently in 2022, when we topped out at 62 degrees to ring in the New Year. There have also been 4 years where the high temperature failed to reach 20 degrees. This last occurred in 2018 when the high only made it up to 13 degrees!
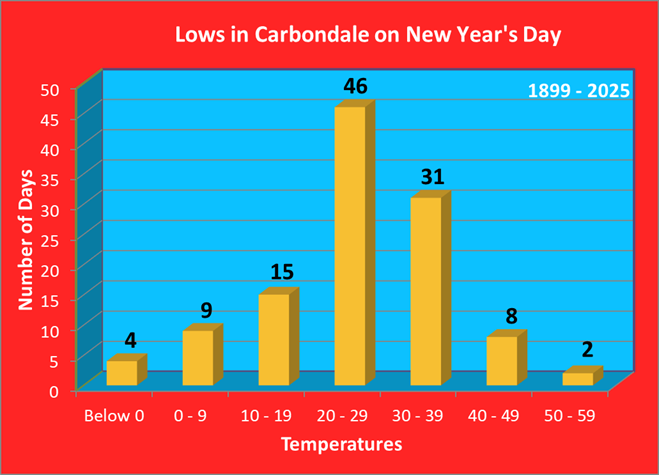
Low temperatures typically fall in the 20s (41% of the time) or 30s (26% of the time). There are always exceptions to the norm of course: in 2018 the low temperature dropped to -1, which is one of four New Year's with lows below 0. There have been 2 years with lows in the 50s, in 2005 and 1966.
| Warmest Lows | Coldest Lows |
| 56 in 2005 | -6 in 1977 |
| 50 in 1966 | -4 in 1928 |
| 46 in 1941 | -3 in 1968 |
| 45 in 1930 | -1 in 2018 |
| 44 in 2023 | 0 in 2001 |
| Normal Low: | 26 |
Measurable precipitation has fallen 32% of the time, with over an inch of precipitation falling 3 times, in 2022, 1979, and 1966.
| Wettest |
| 2.09 in 1966 |
| 1.72 in 2021 |
| 1.16 in 1979 |
| 0.79 in 1942 |
| 0.64 in 1930 |
Here is a look at the observed weather for the past 15 years:
| Recent New Year's Weather | |||
| Year | High | Low | Precip |
| 2011 | 54 | 20 | T |
| 2012 | 57 | 36 | 0 |
| 2013 | 33 | 20 | 0 |
| 2014 | 46 | 30 | 0.03 |
| 2015 | 41 | 22 | 0 |
| 2016 | 41 | 26 | 0 |
| 2017 | 46 | 37 | 0 |
| 2018 | 13 | -1 | 0 |
| 2019 | 45 | 35 | 0 |
| 2020 | 53 | 27 | 0 |
| 2021 | 45 | 31 | 0.58 |
| 2022 | 62 | 34 | 1.72 |
| 2023 | 57 | 44 | 0 |
| 2024 | 38 | 33 | 0 |
| 2025 | 40 | 28 | 0 |

