A storm system will continue to produce widespread showers and thunderstorms as it progresses eastward across the central U.S. into the Northeast through the weekend. There are risks of severe thunderstorms and excessive rainfall on Saturday from the Ozarks into the mid-Mississippi River Valley with potential for damaging winds, large hail, tornadoes, and flash flooding. Read More >
These images are updated once an hour. View neighboring state forecast data from Kansas and Iowa,
view local data for eastern NE and western IA, or view other forecast data at our National Digital Forecast Viewer.
Severe Weather Graphics
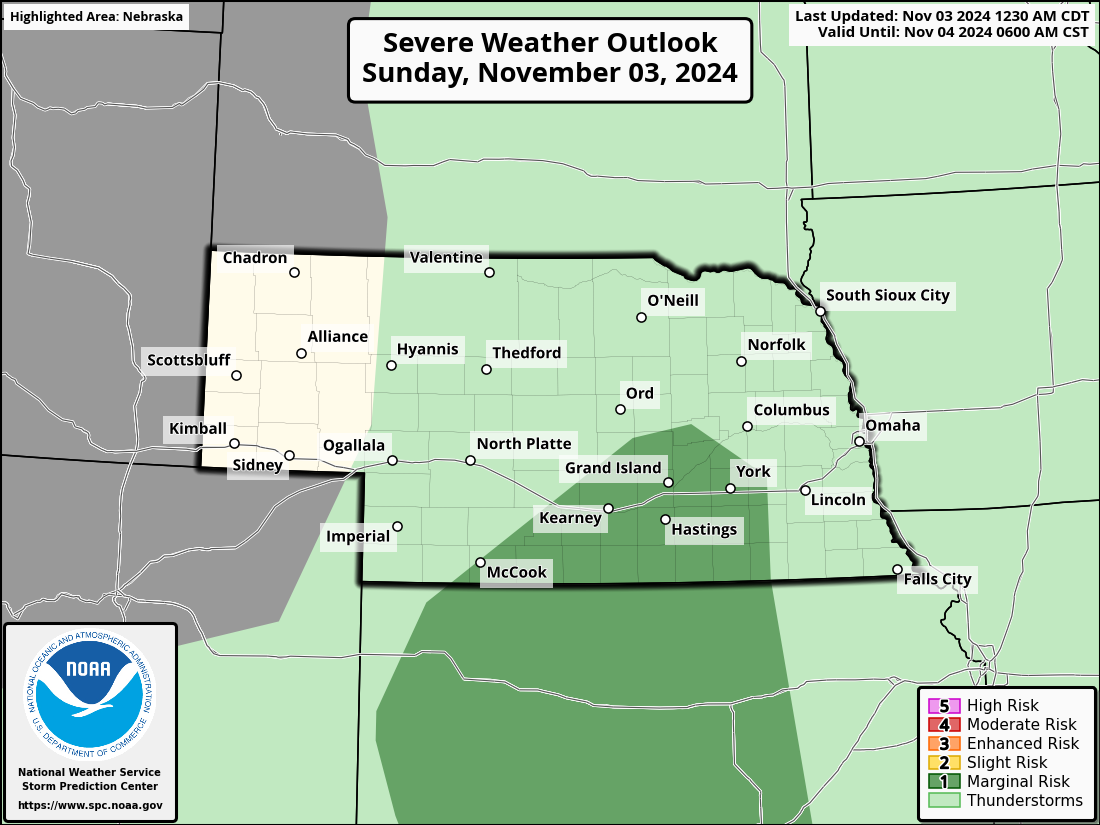
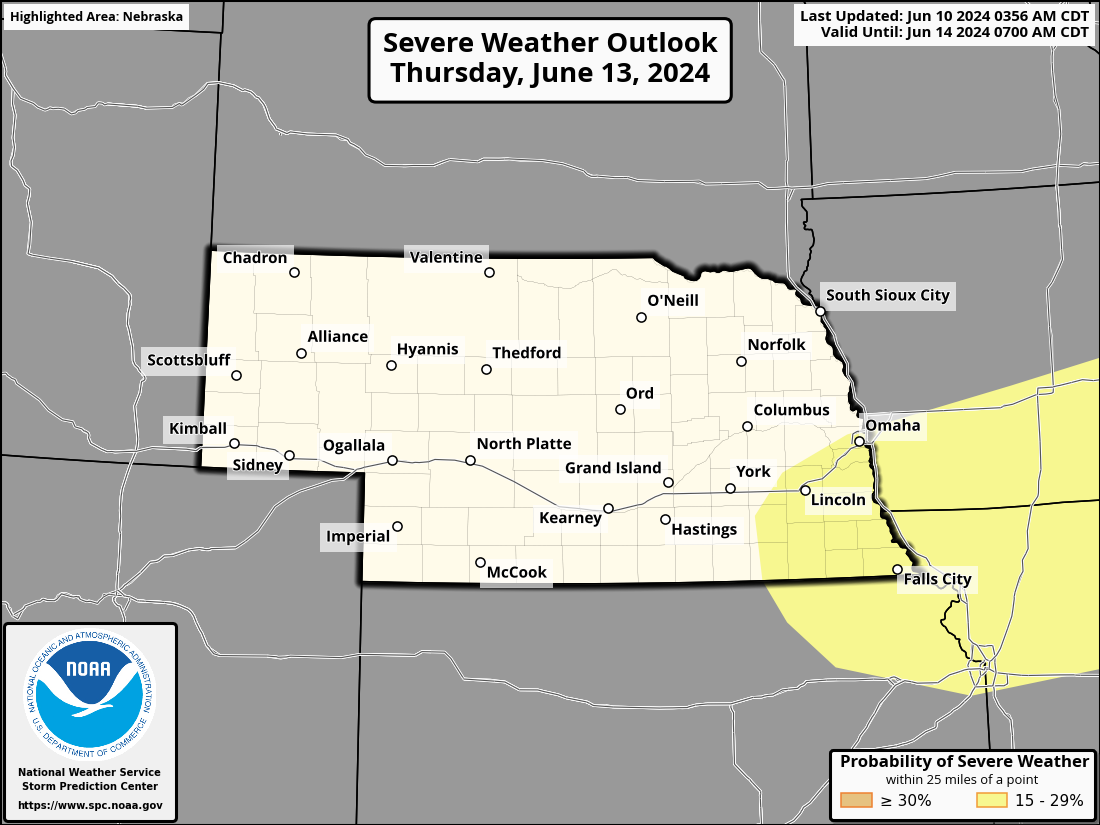
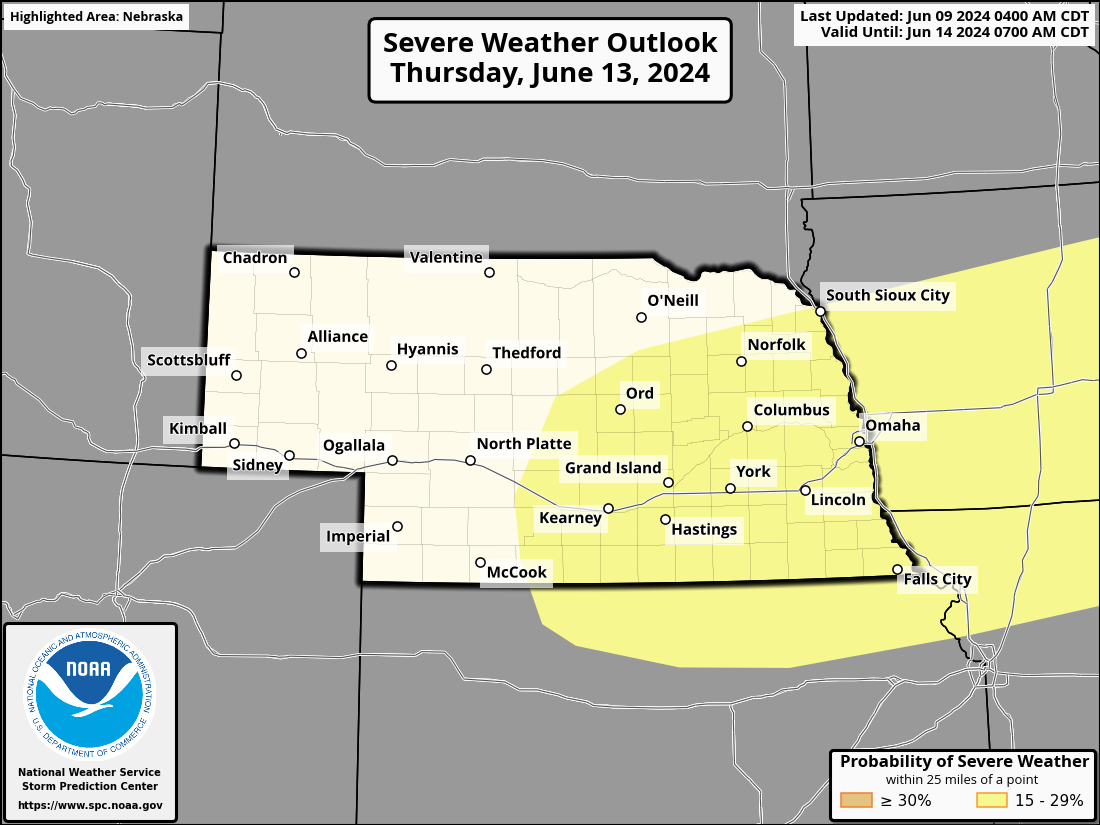
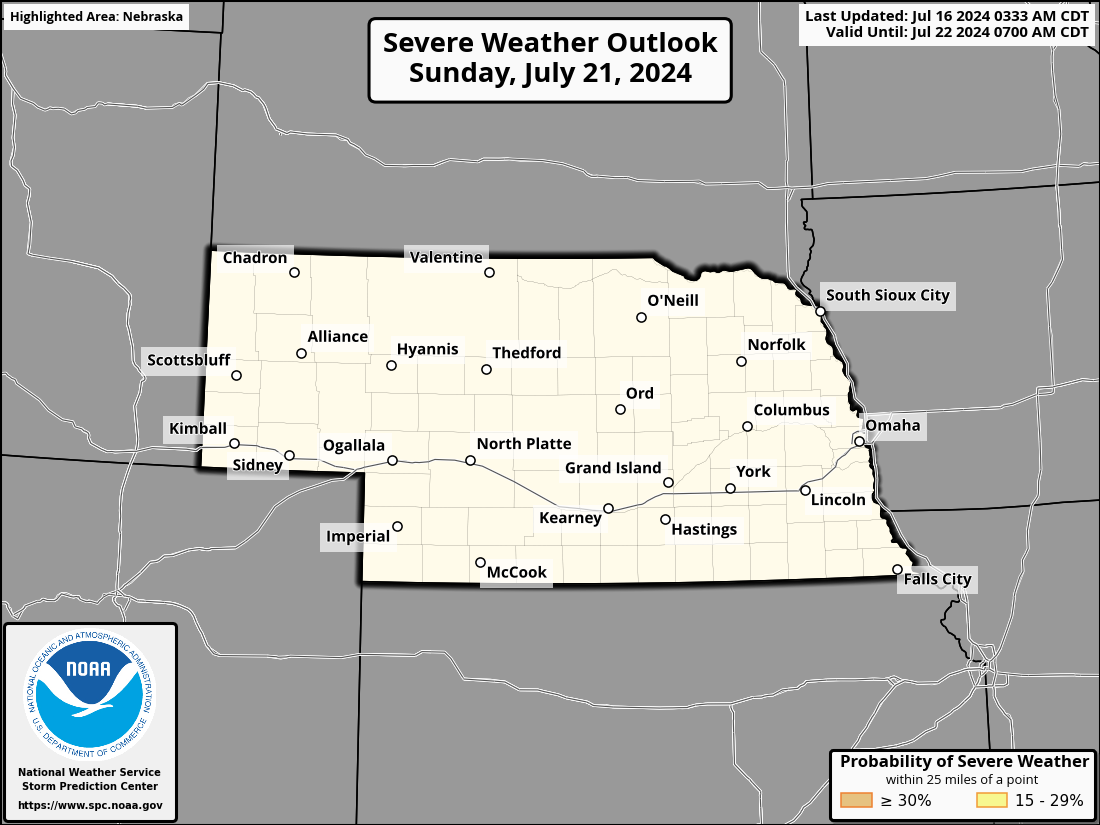
SPC Day 1 Outlook
|
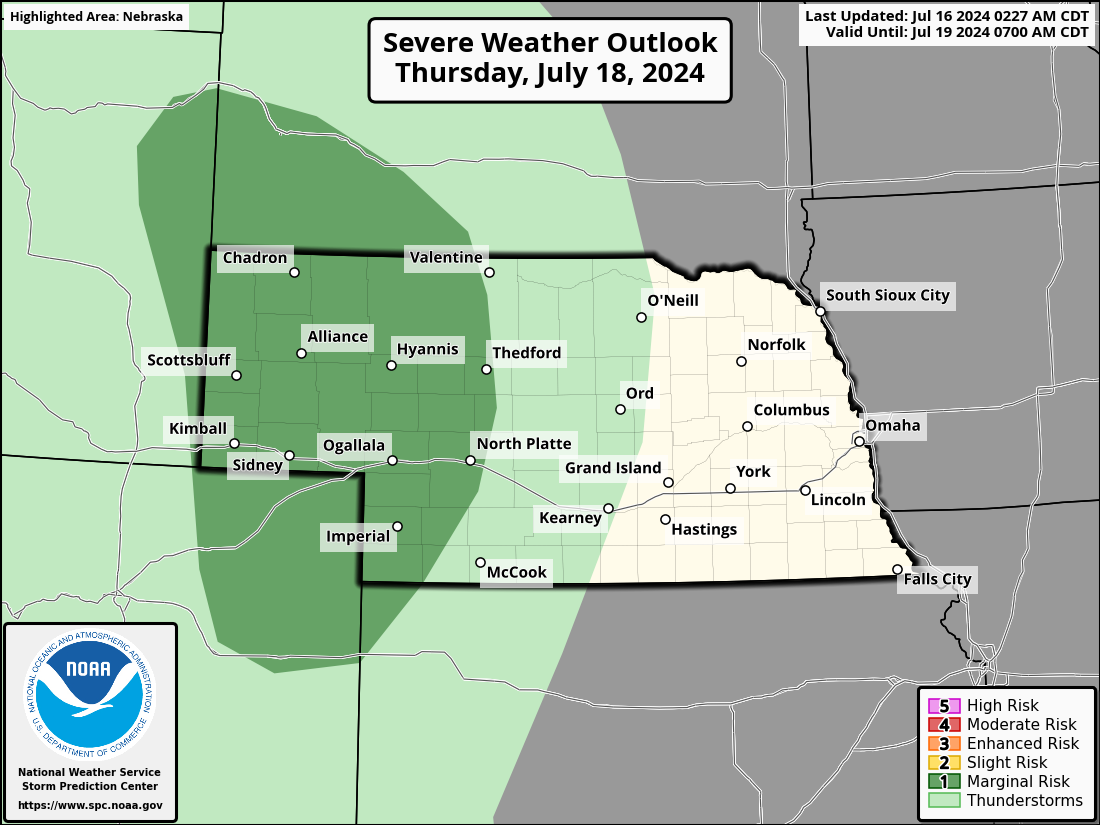
SPC Day 1 Severe Weather Outlook |
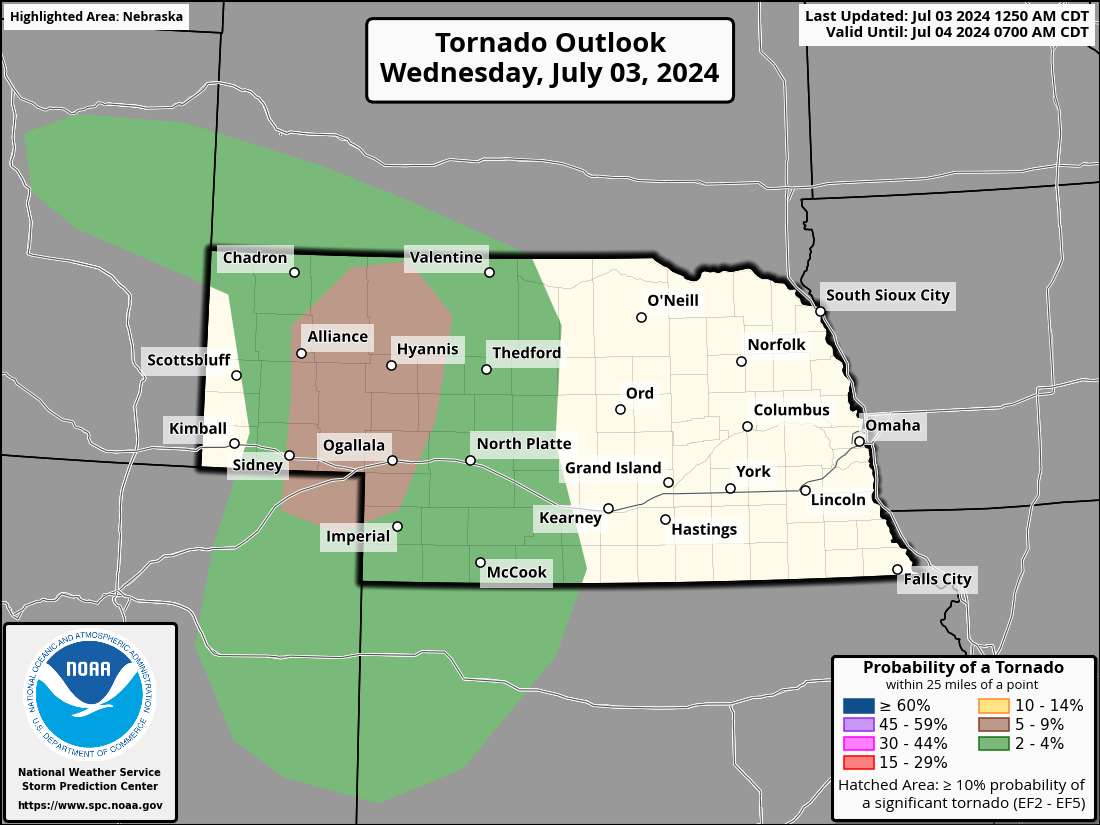
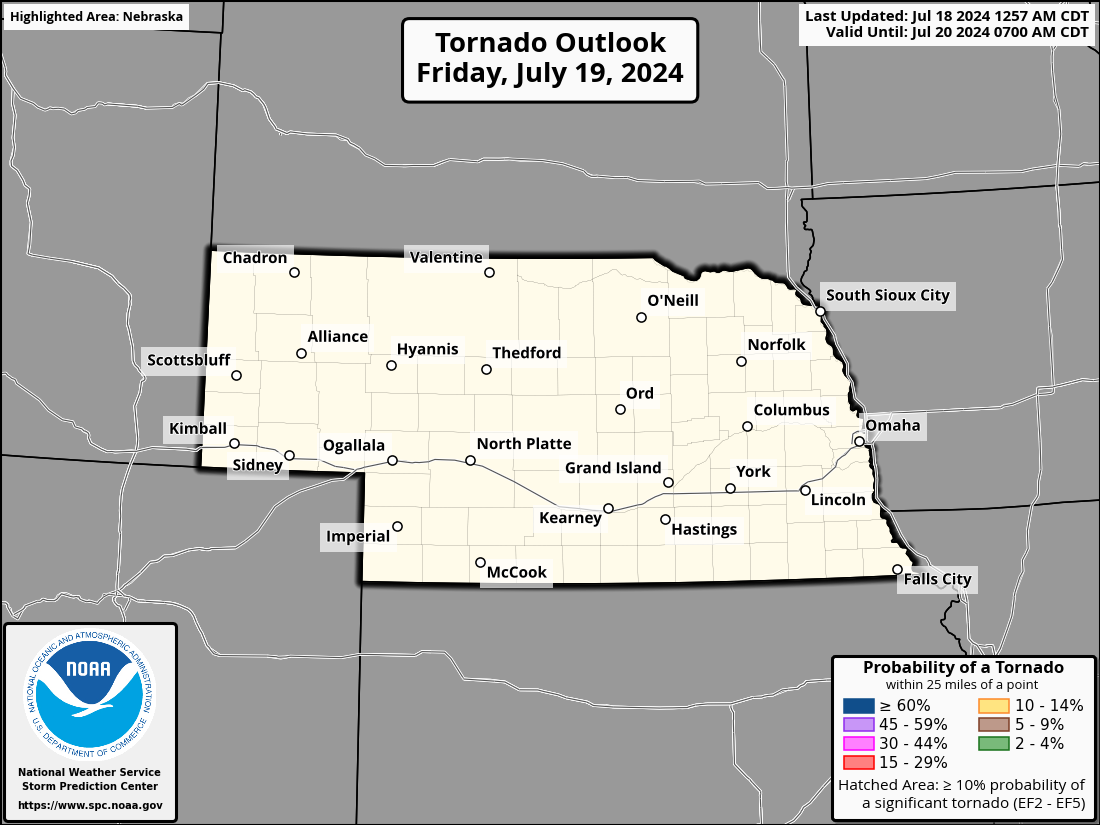
SPC Day 1 Tornado Outlook |
|
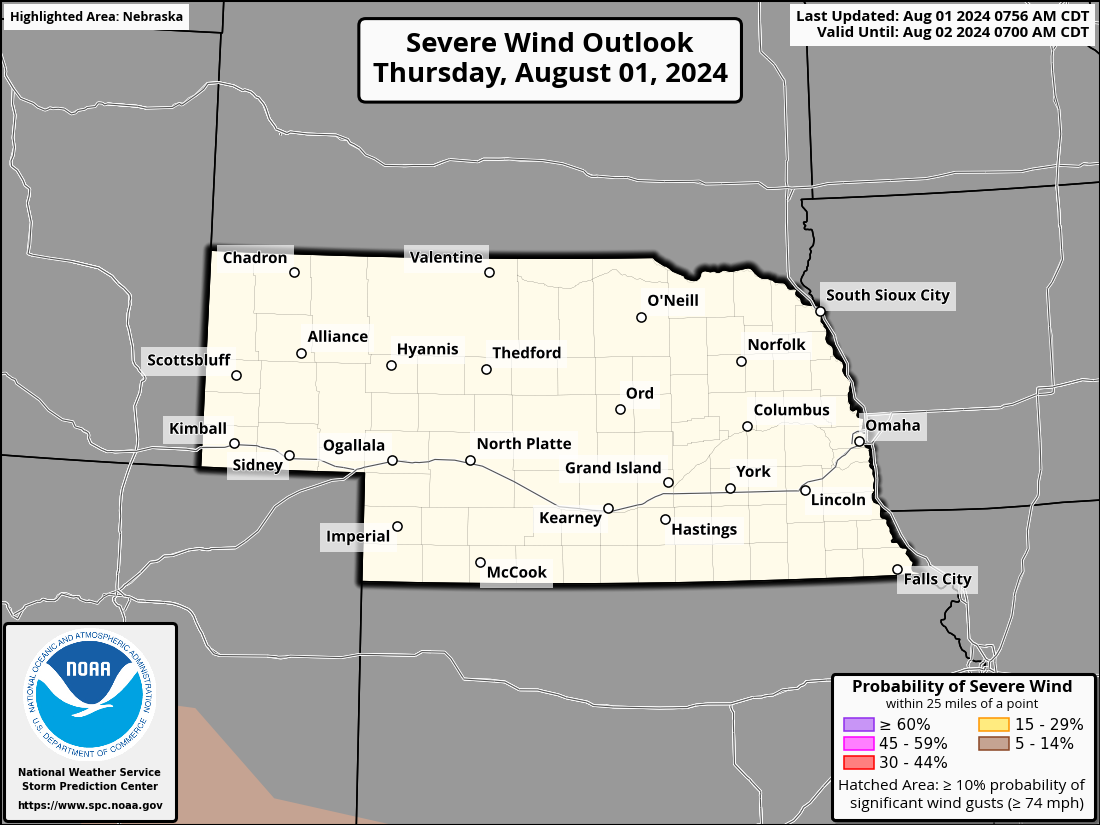
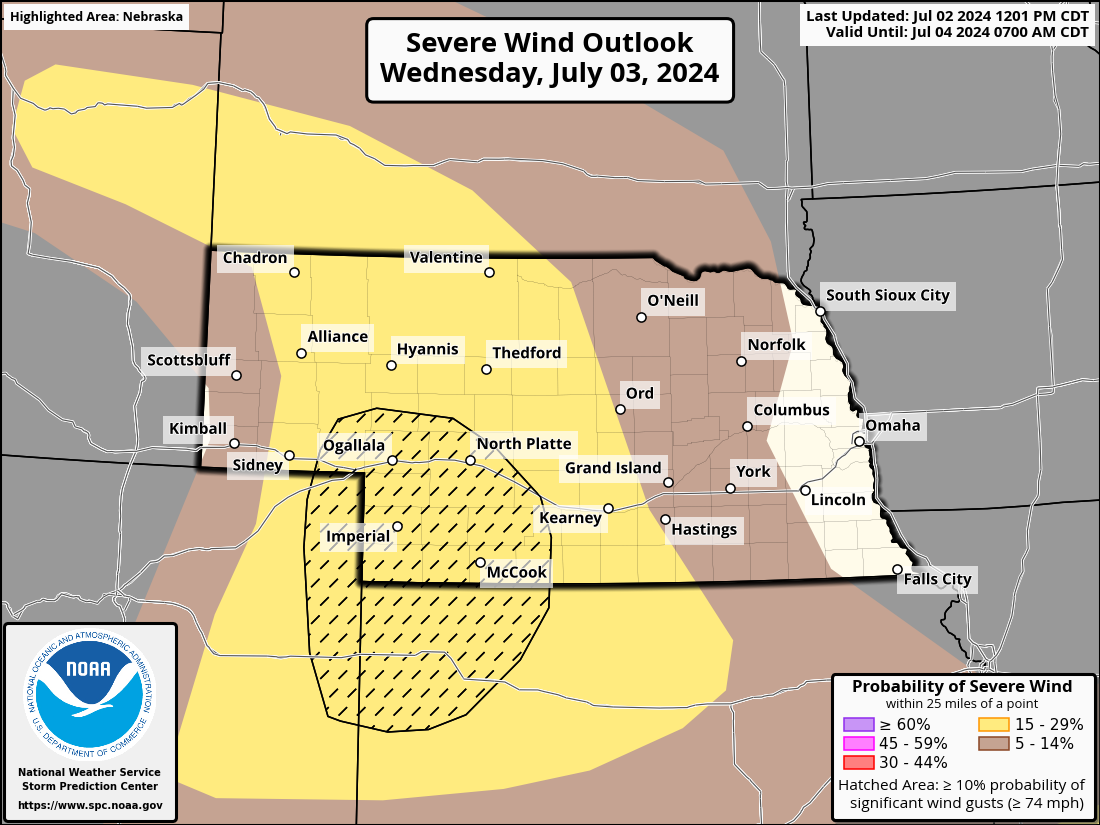
SPC Day 1 Wind Outlook |
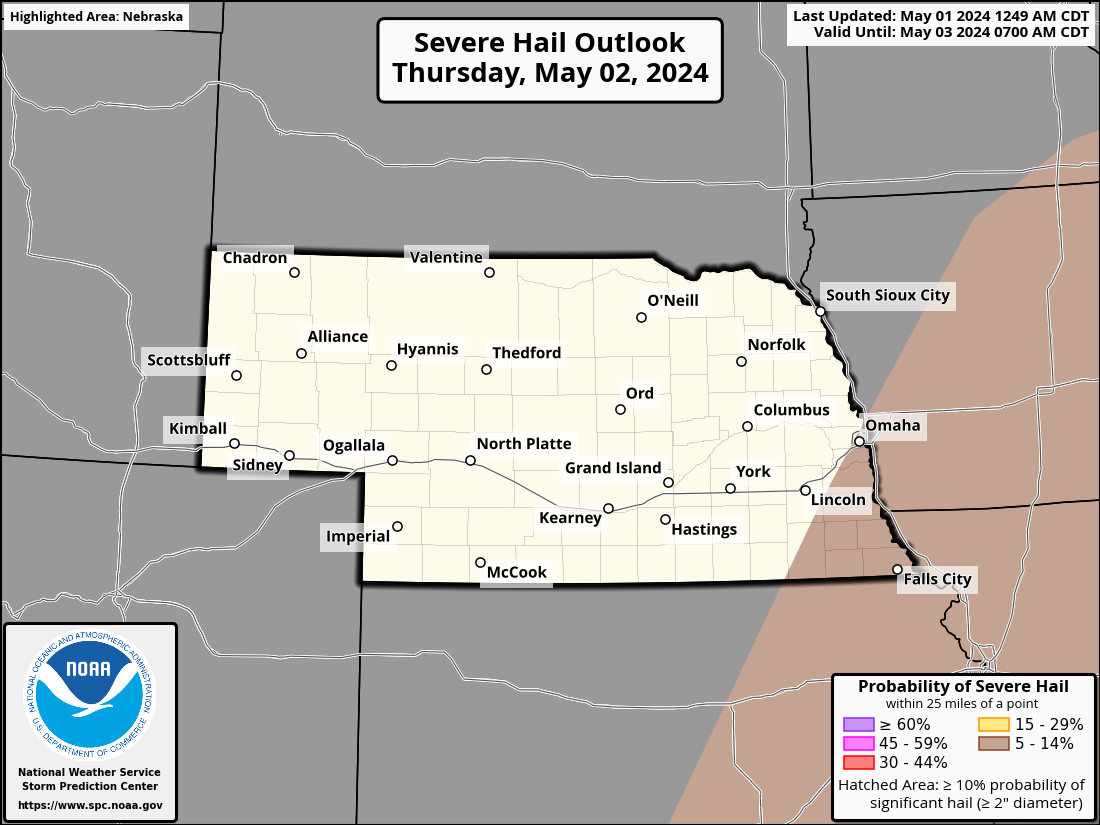
SPC Day 1 Hail Outlook |
SPC Day 2 Outlook
|
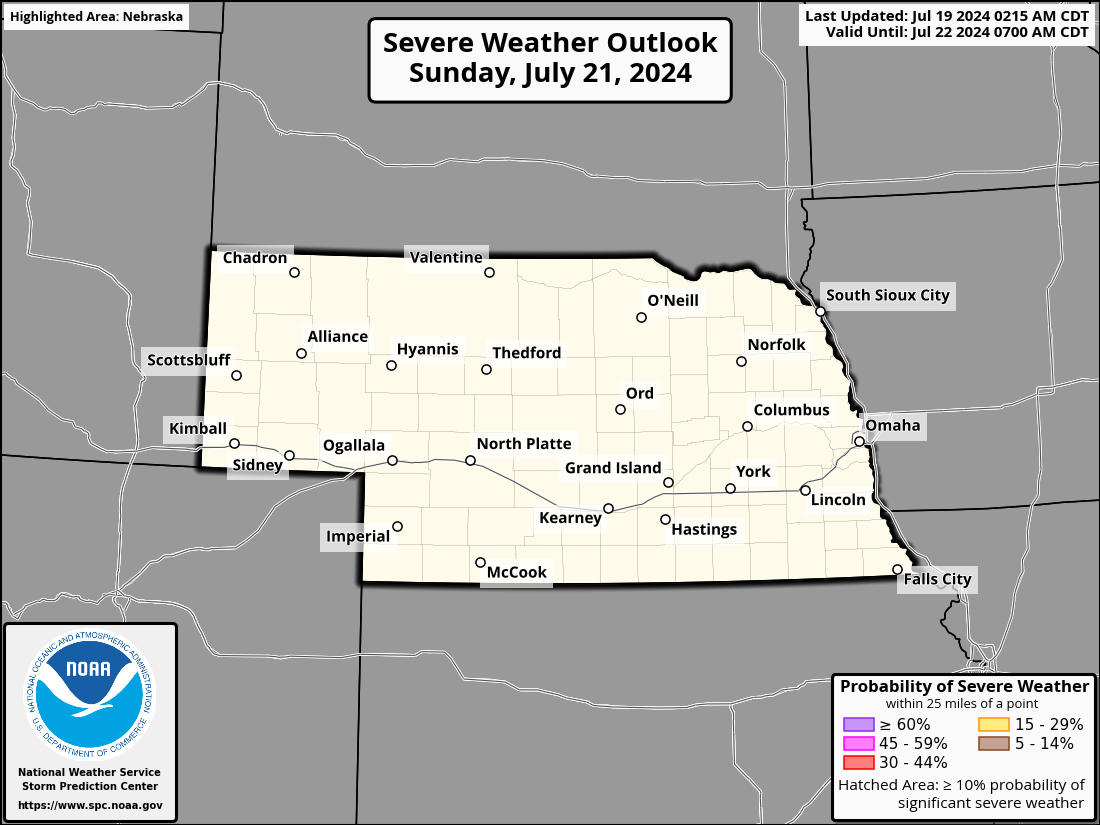
SPC Day 2 Severe Weather Outlook |
SPC Day 2 Tornado Outlook |
|
SPC Day 2 Wind Outlook |
SPC Day 2 Hail Outlook |
SPC Day 3 Outlook
|
SPC Day 3 Severe Weather Outlook |
SPC Day 3 Probabilistic Outlook |
SPC Days 4-8 Outlooks
|
SPC Day 4 Severe Weather Outlook |
SPC Day 5 Severe Weather Outlook |
|
SPC Day 6 Severe Weather Outlook |
SPC Day 7 Severe Weather Outlook |
|
SPC Day 8 Severe Weather Outlook |
|
Precipitation Graphics
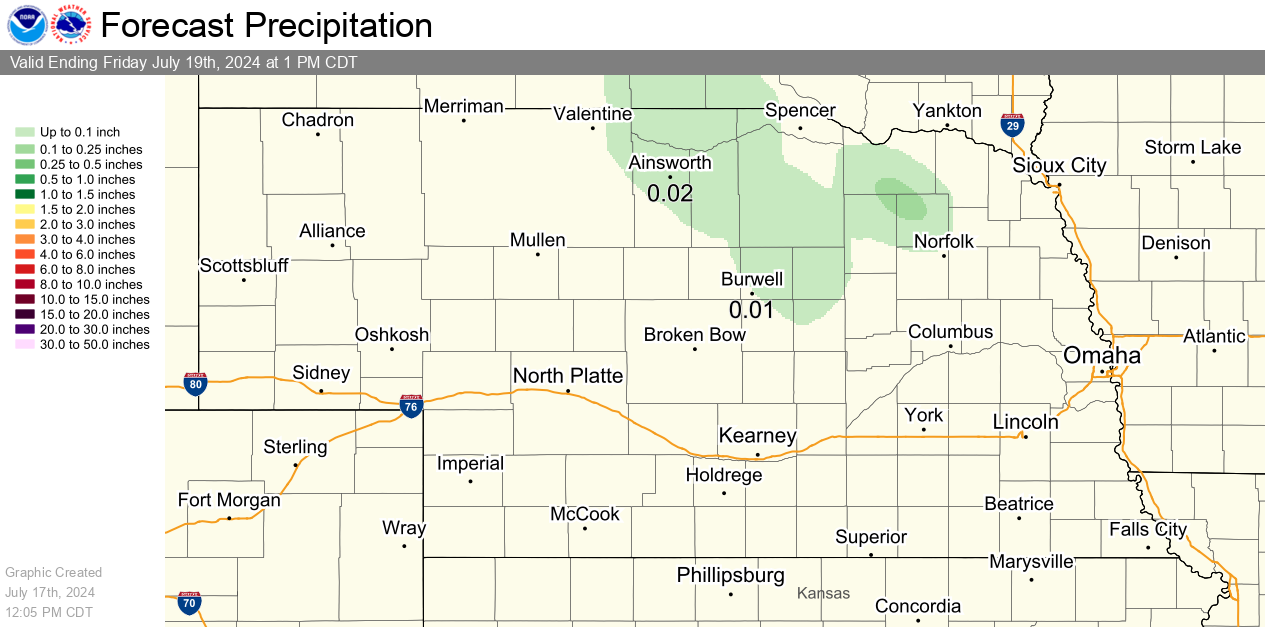
Rainfall Forecasts
Precipitation accumulation measured in six hourly periods, starting at 12am, 6am, 12pm, and 6pm CST (+1 CDT).
|
Day 1 24-hour Rainfall Forecast |
Day 2 24-hour Rainfall Forecast |
|
Day 3 24-hour Rainfall Forecast |
7 Day Rainfall Forecast |
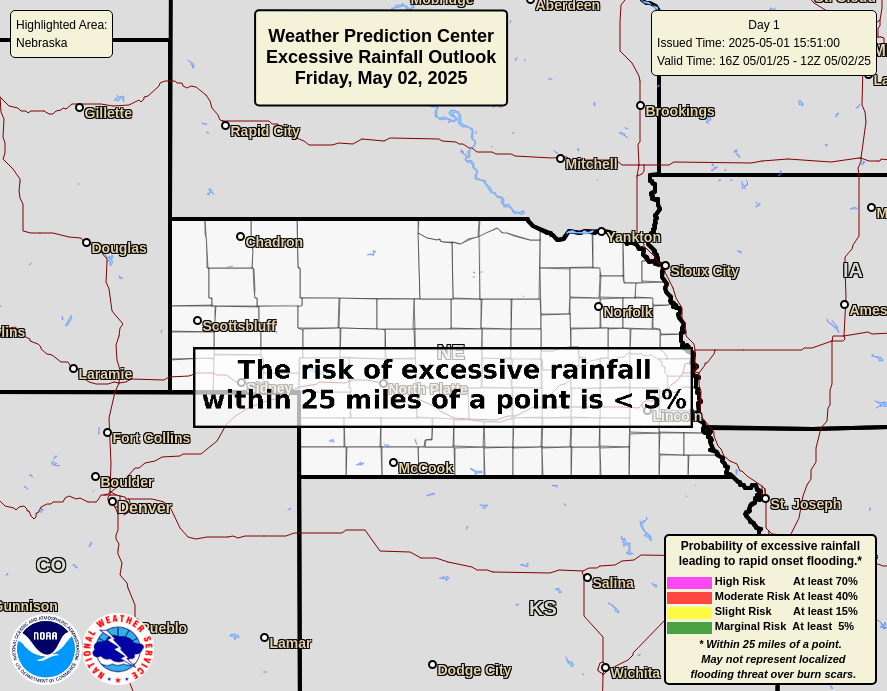
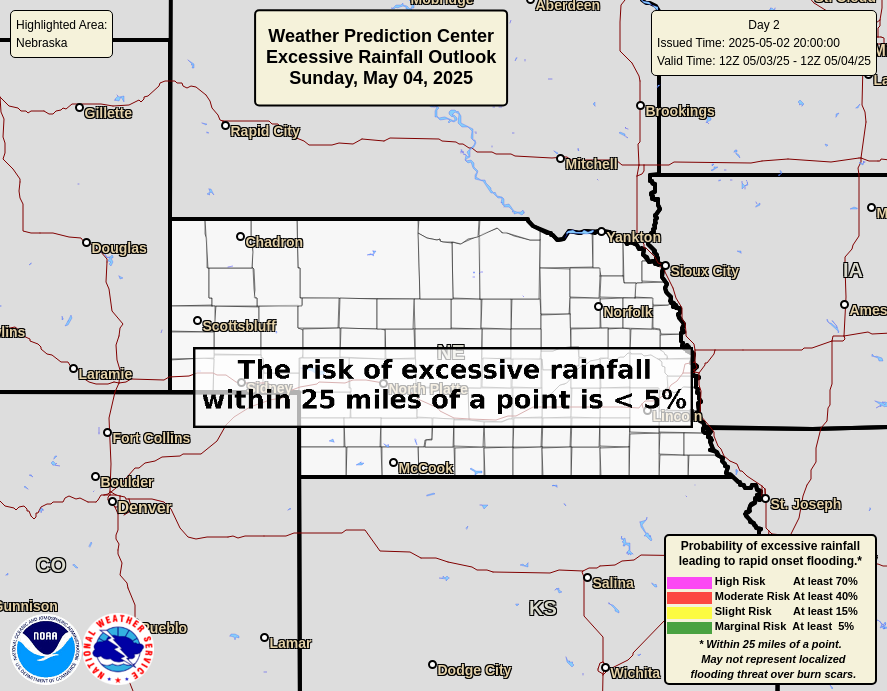
Excessive Rainfall Outlooks
|
Day 1 Outlook |
Day 2 Outlook |
|
Day 3 Outlook |
|
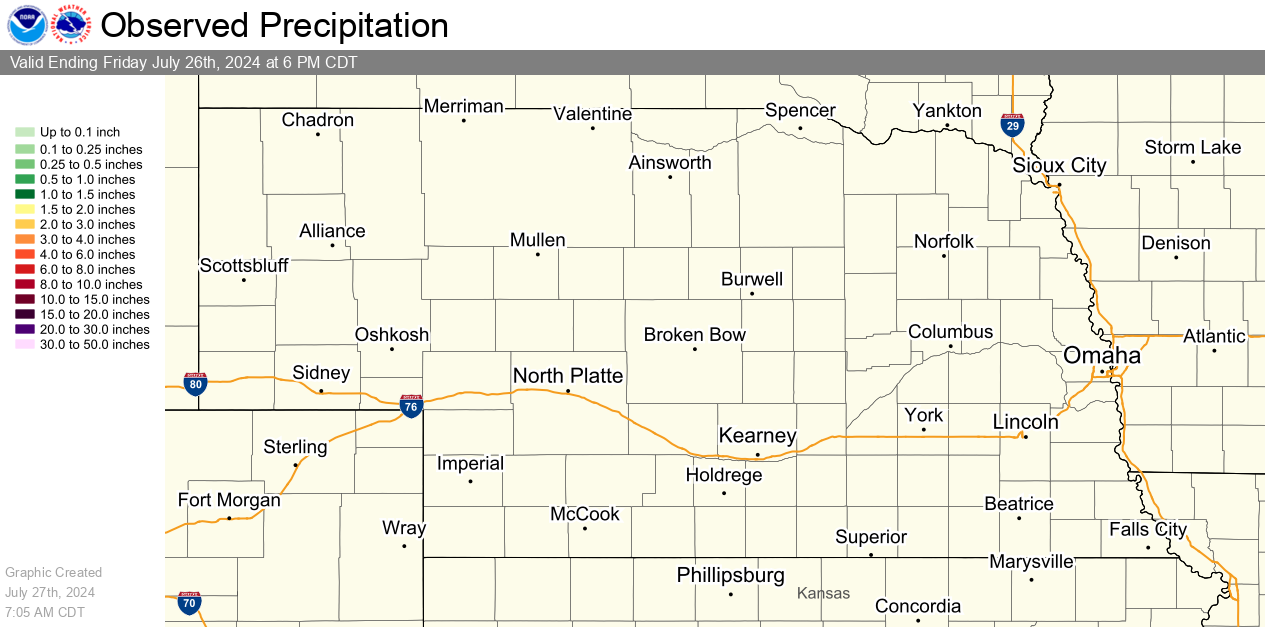
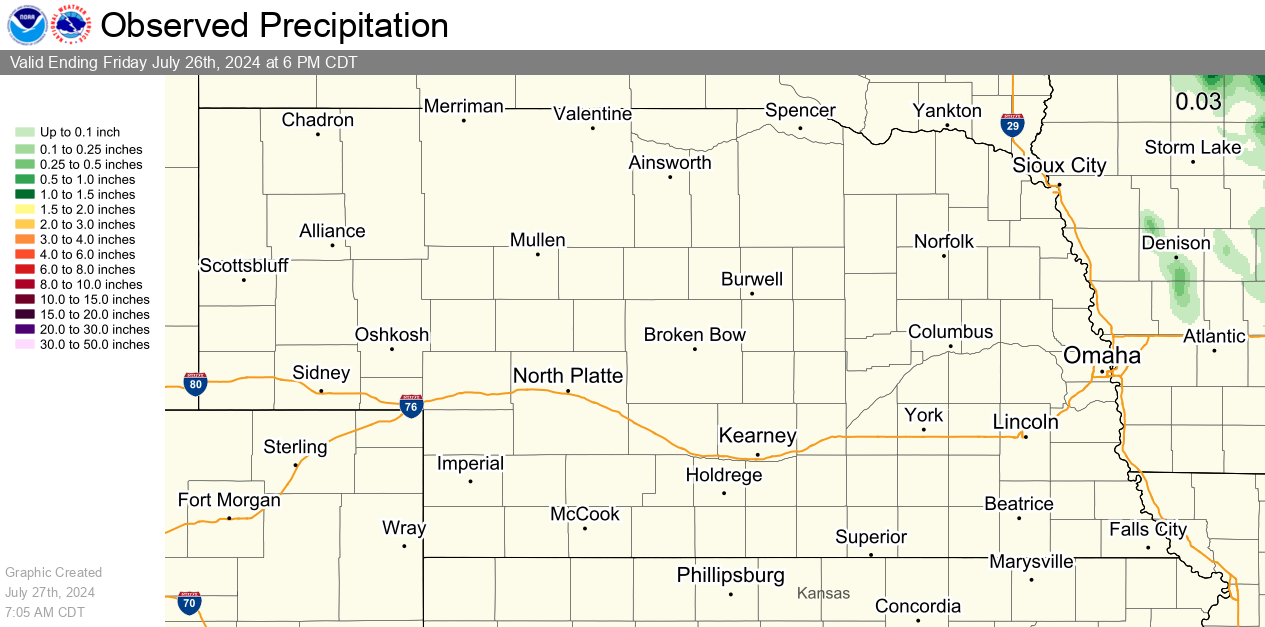
Observed Precipitation (source: MRMS)
|
Previous 24 Hours of Precipitation |
Previous 72 Hours of Precipitation |
Humidity and Wind Graphics
Minimum Relative Humidity Forecasts
|
Today's Minimum Relative Humidity Forecast |
Tomorrow's Minimum Relative Humidity Forecast |
|
Day 3 Minimum Relative Humidity Forecast |
|
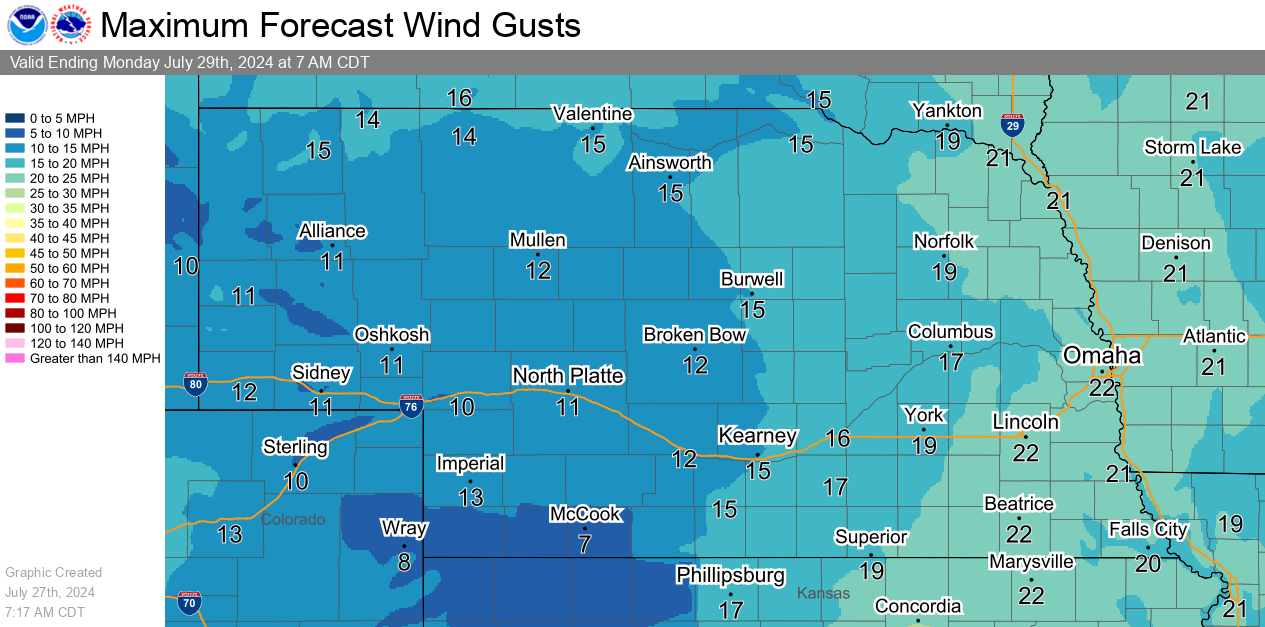
Maximum Wind Gust Forecasts
Heat Index Graphics
Snow, Ice and Wind Chill Graphics
Snowfall
Snowfall accumulation measured in six hourly periods, starting at 12am, 6am, 12pm, and 6pm CST (+1 CDT).
|
12 Hour Snow Accumulation Forecast |
24 Hour Snowfall Accumulation Forecast |
|
48 Hour Snow Accumulation Forecast |
72 Hour Snow Accumulation Forecast |
Ice
Ice accumulation measured in six hourly periods, starting at 12am, 6am, 12pm, and 6pm CST (+1 CDT).
|
12 Hour Ice Accumulation Forecast |
24 Hour Ice Accumulation Forecast |
|
48 Hour Ice Accumulation Forecast |
72 Hour Ice Accumulation Forecast |
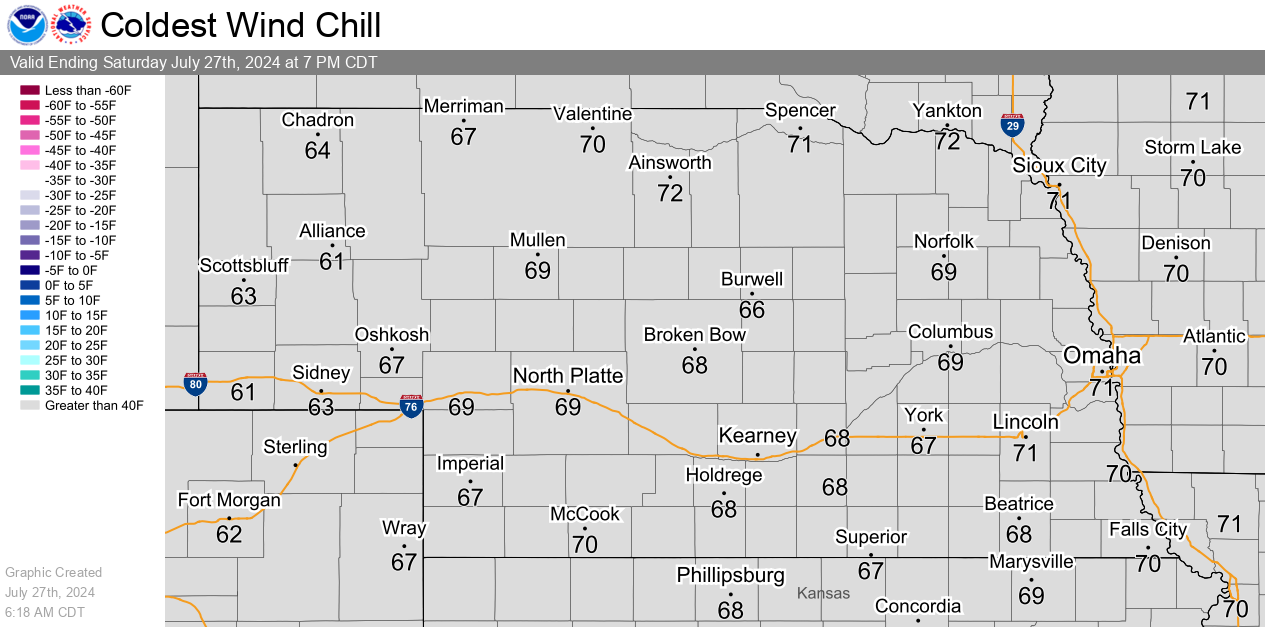
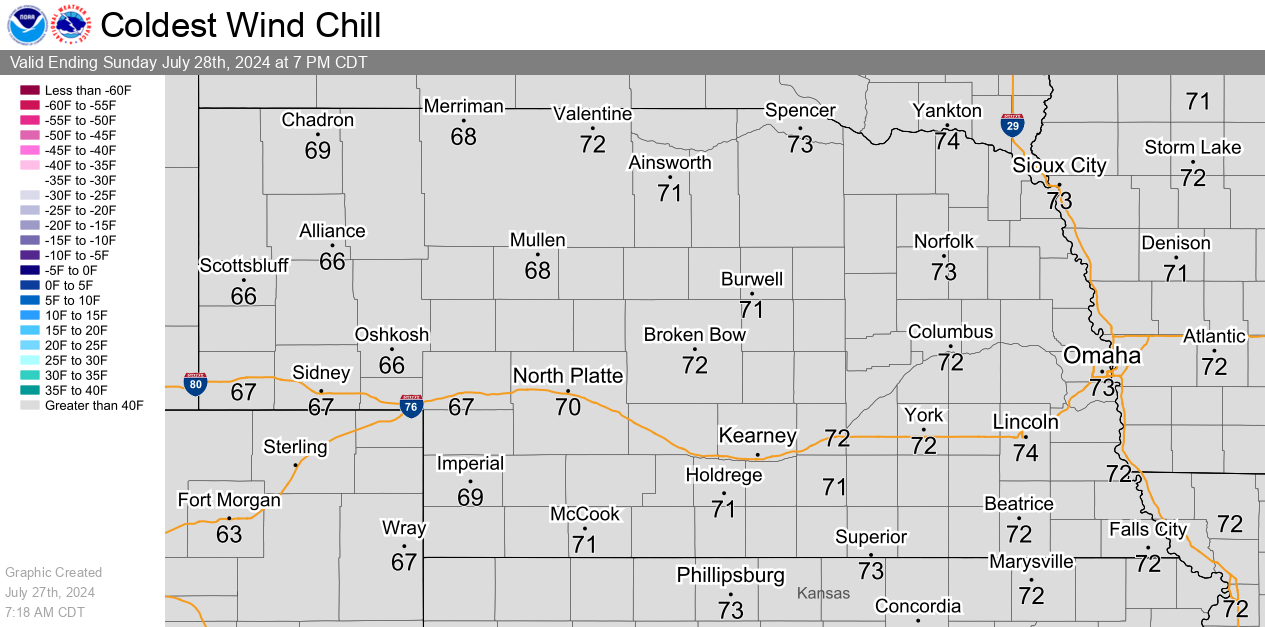
Wind Chill
Climate Graphics