Missouri Basin, Pleasant Hill
River Forecast Center
|
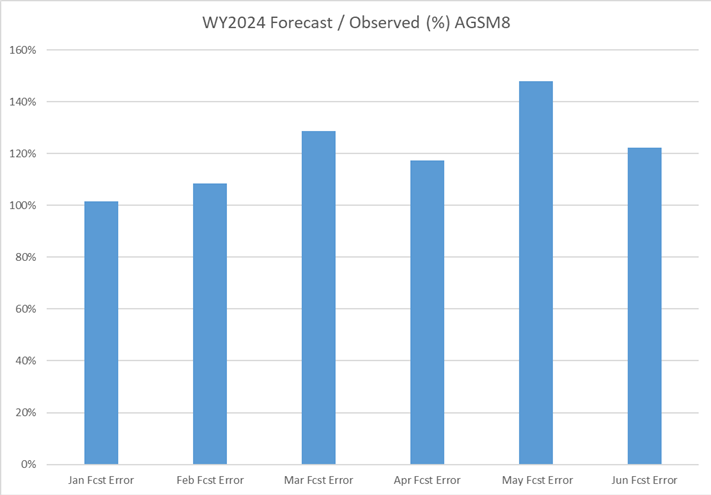
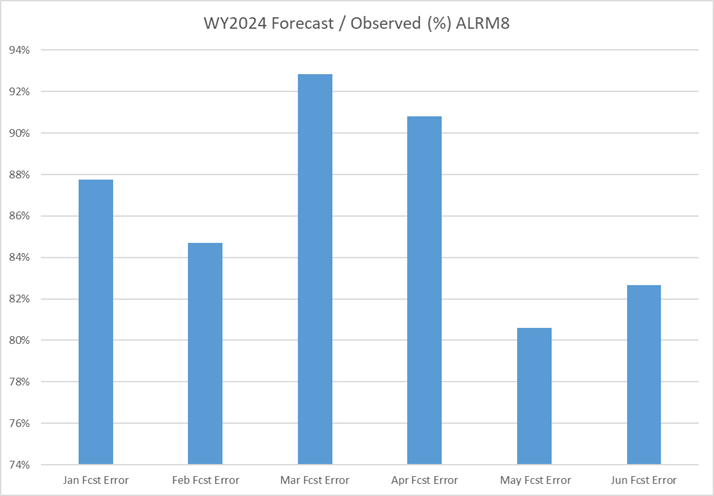
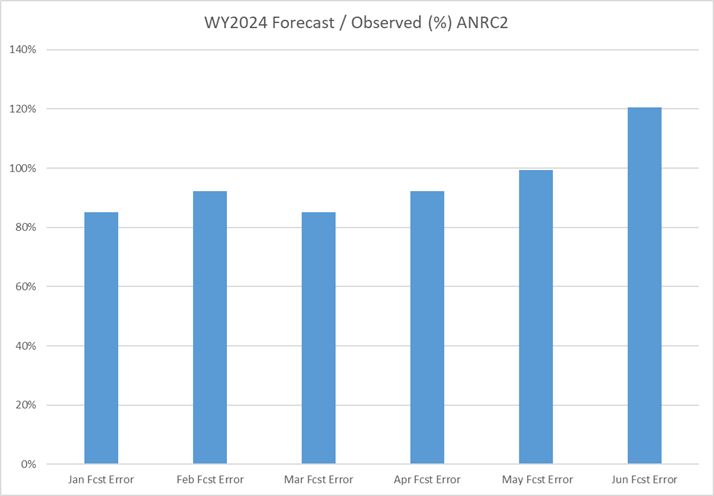
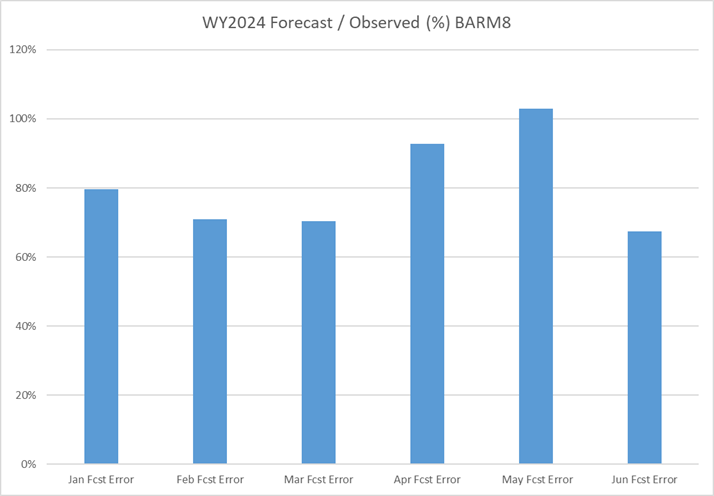
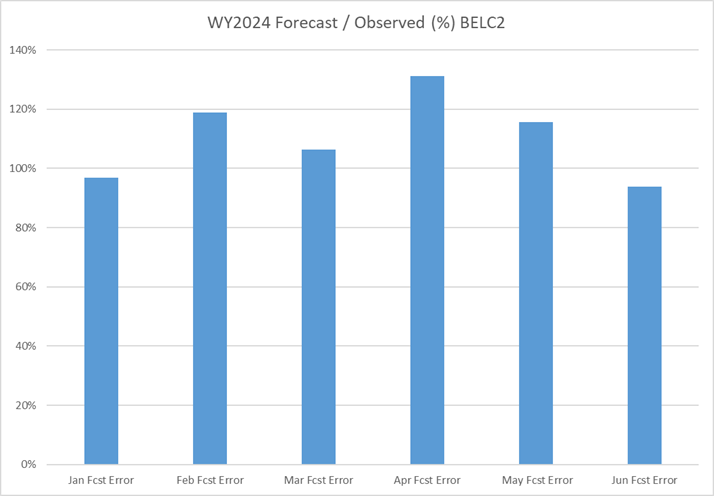
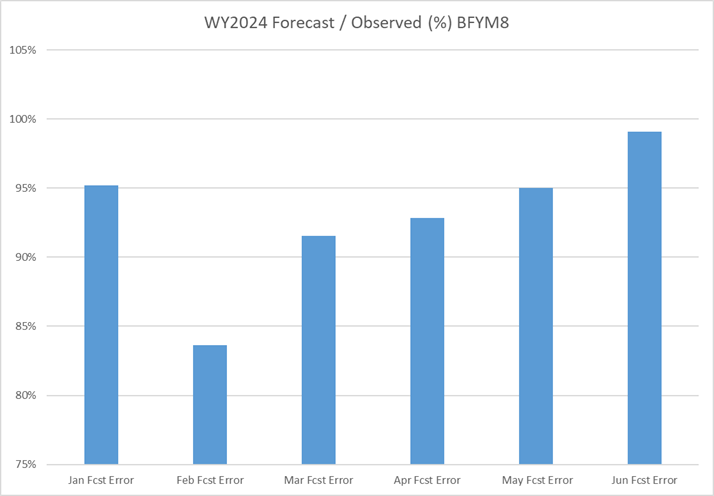
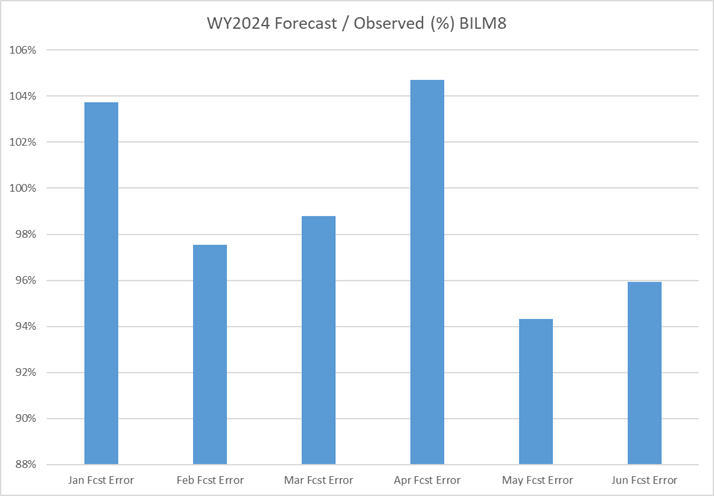
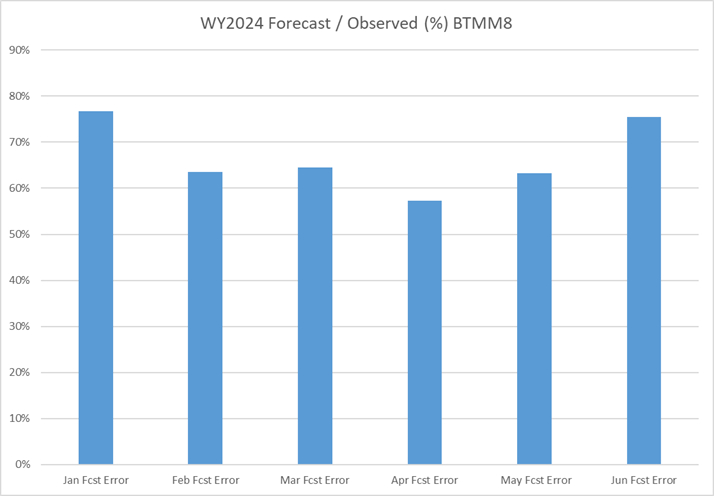
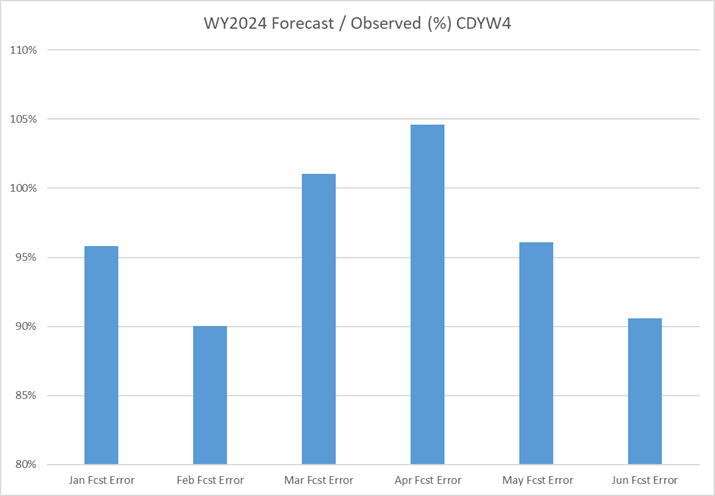
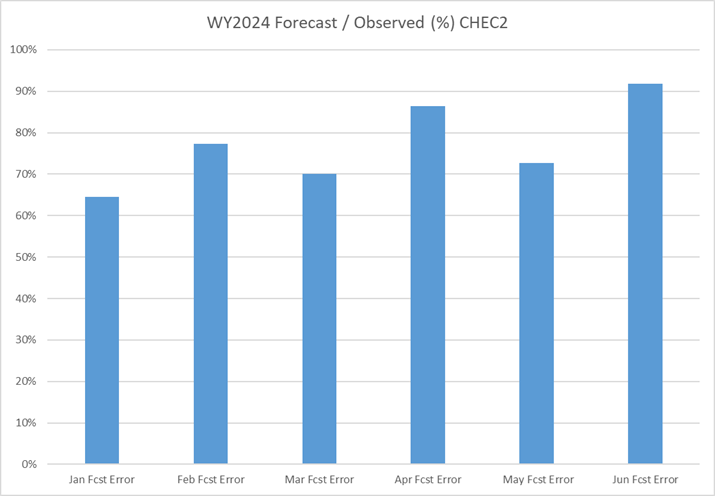
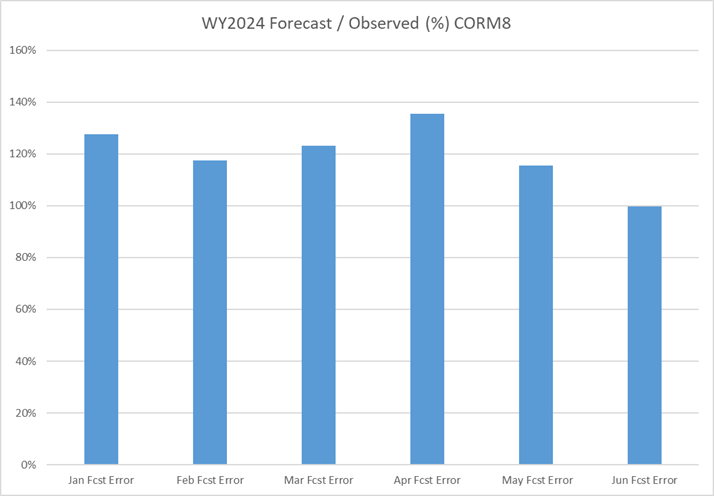
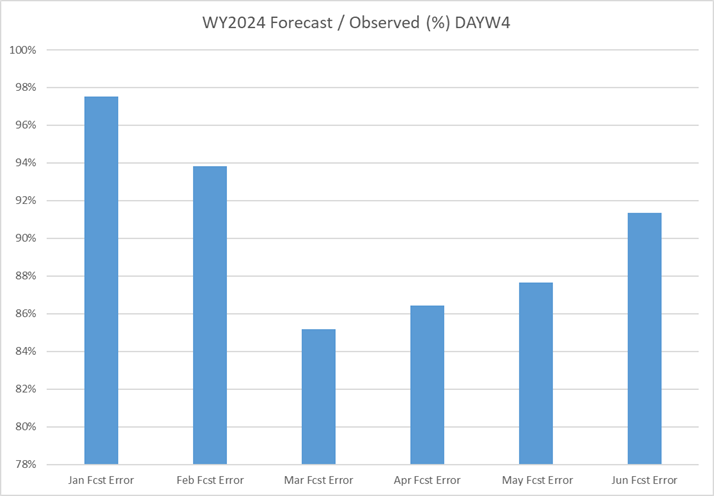
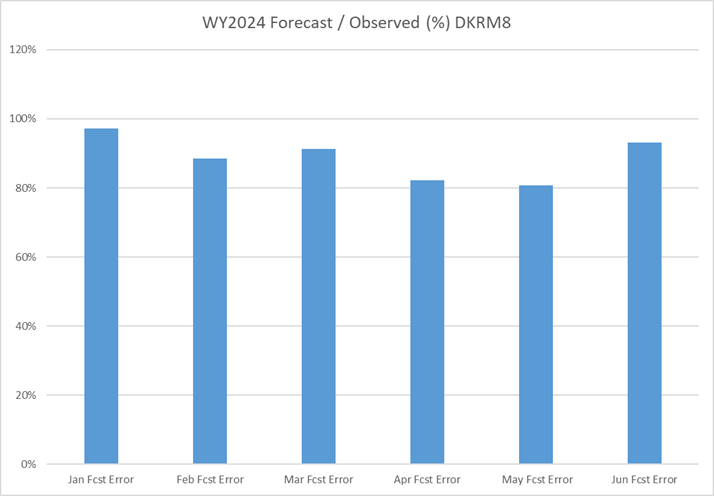
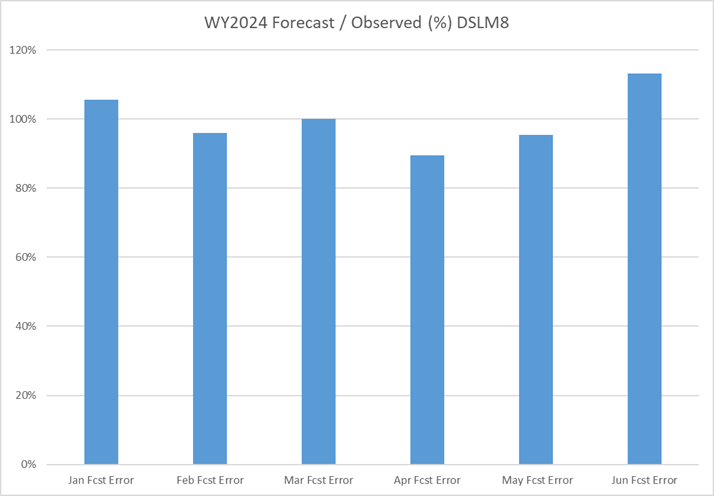
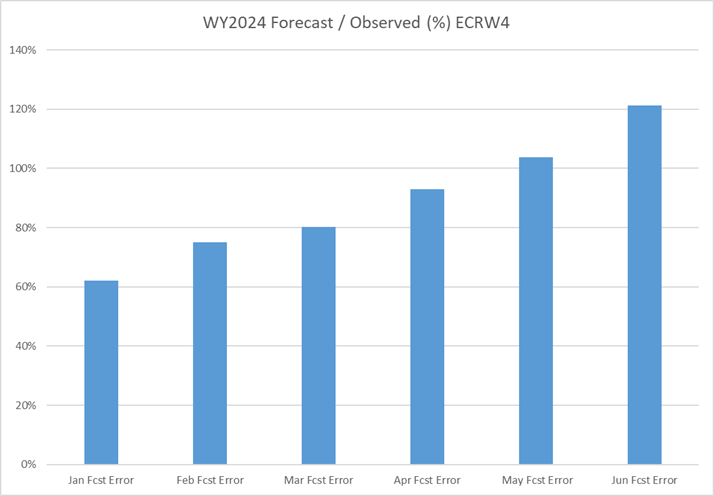
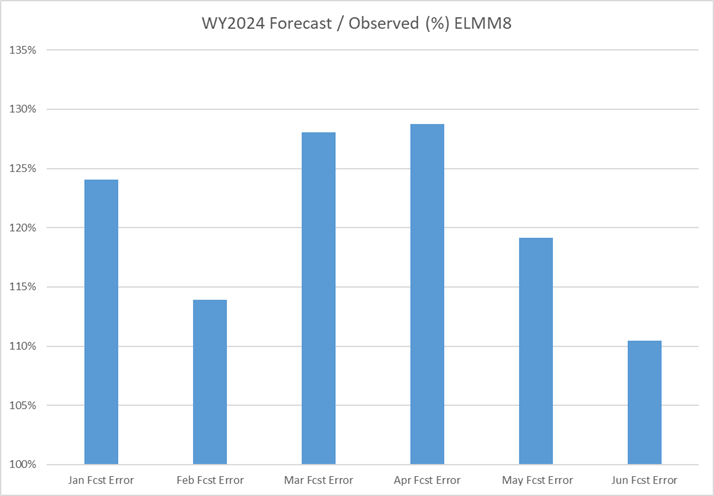
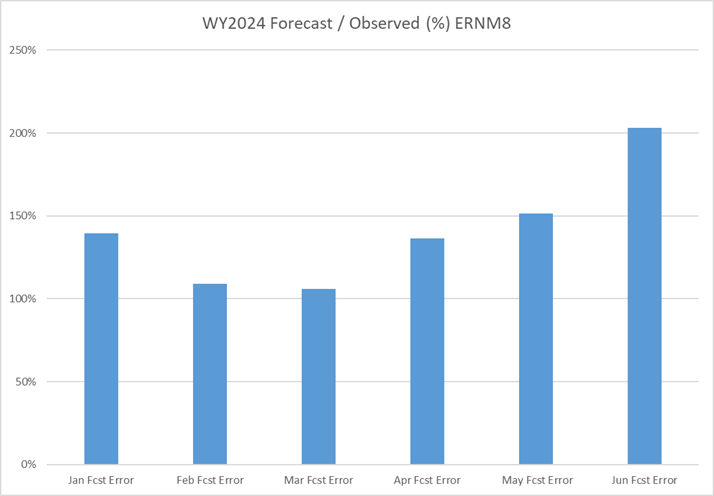
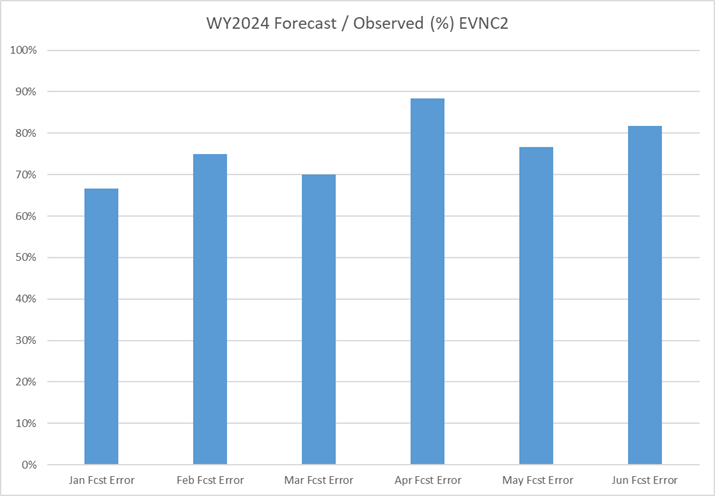
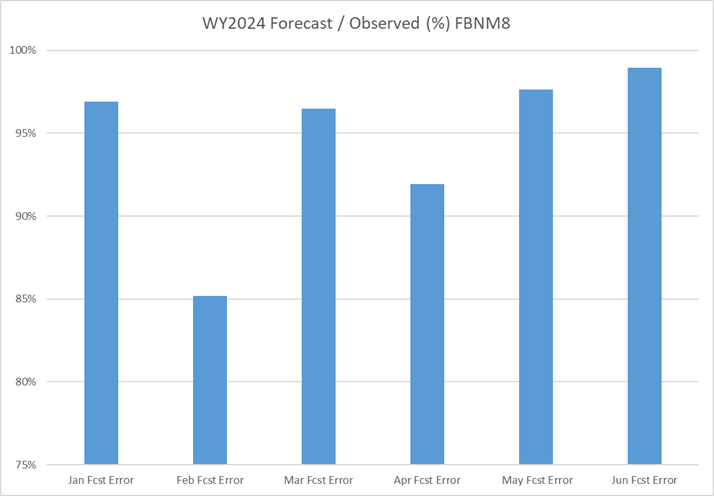
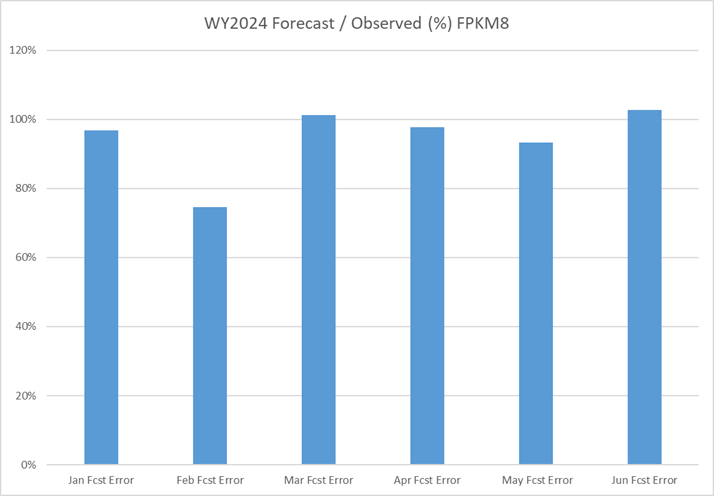
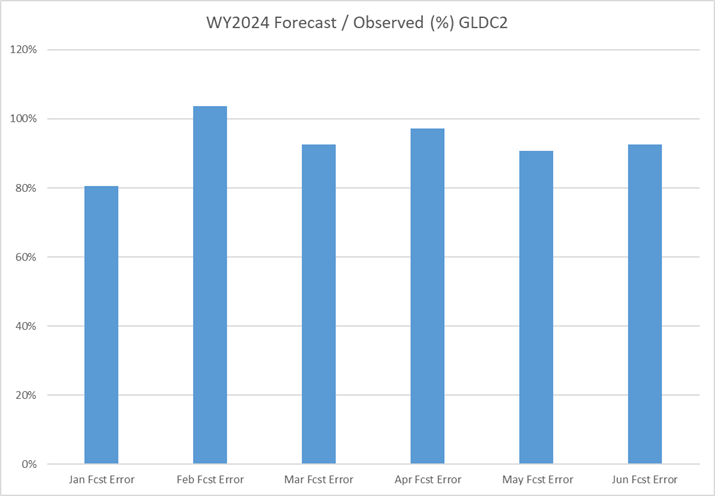
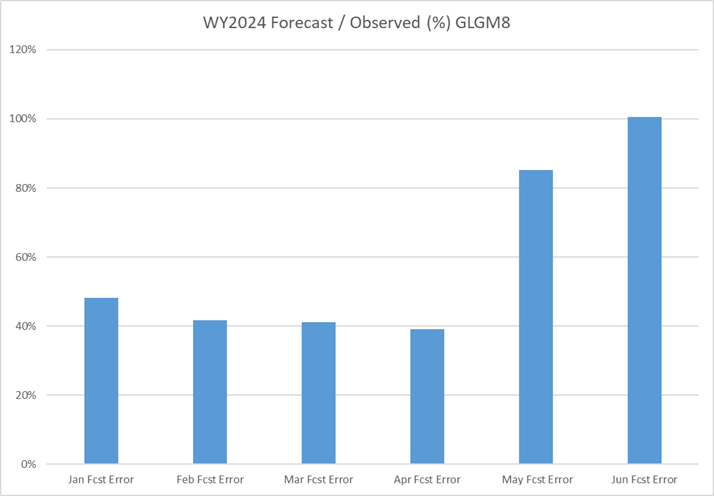
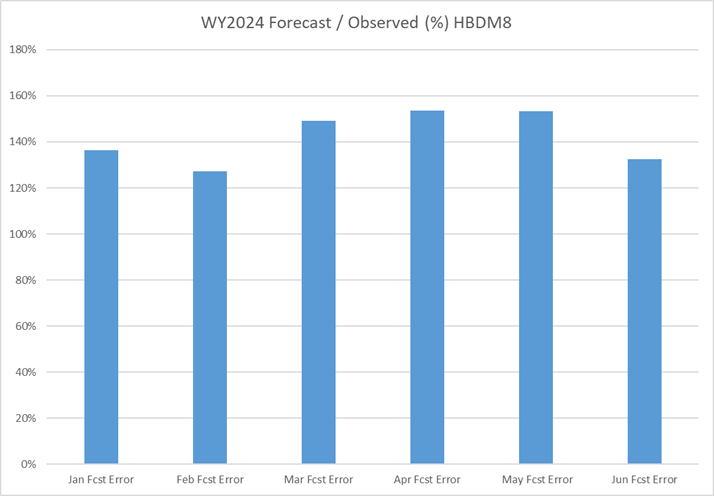
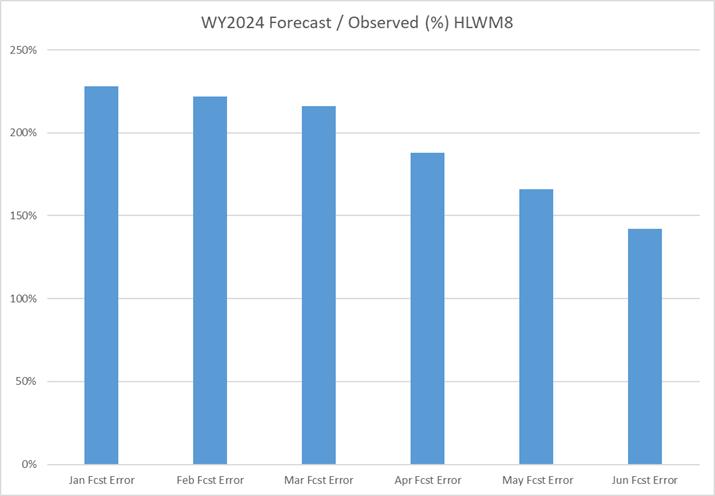
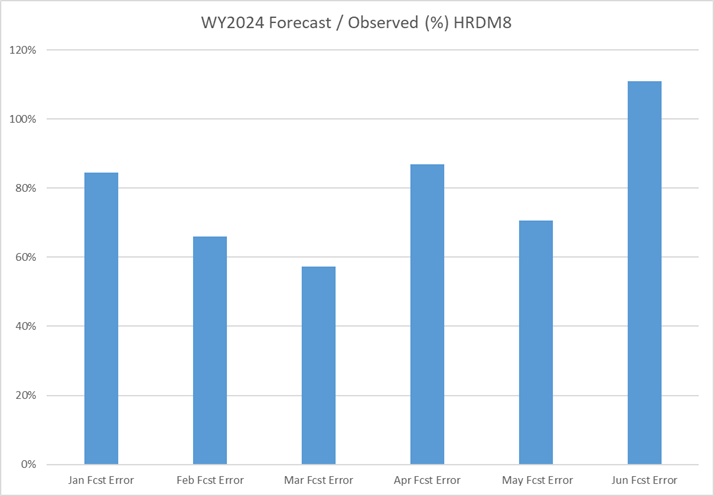
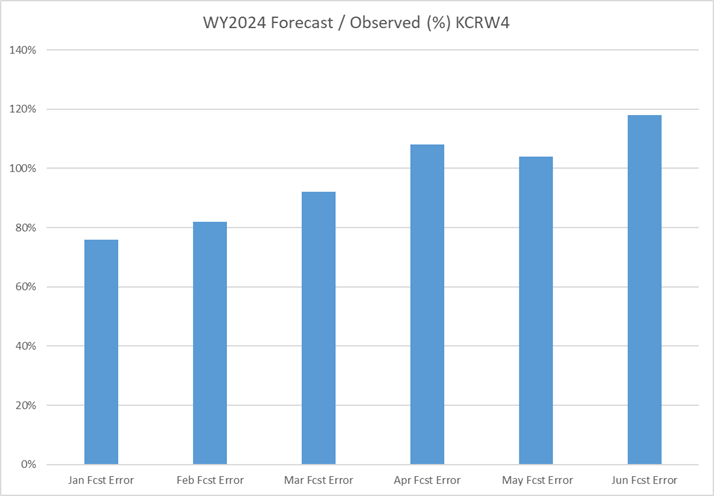
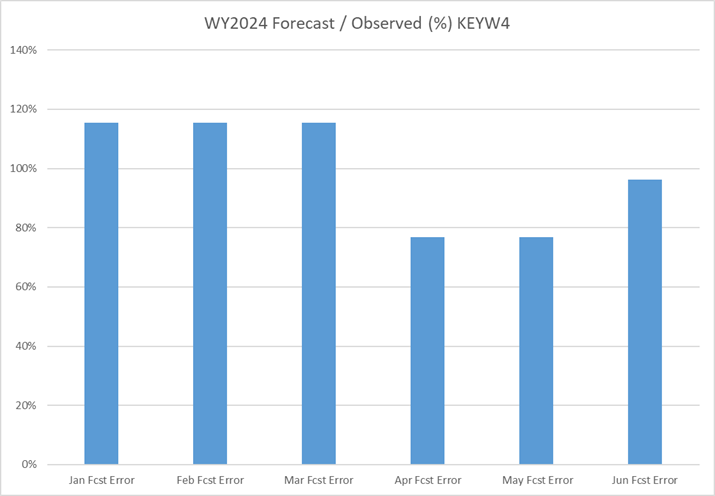
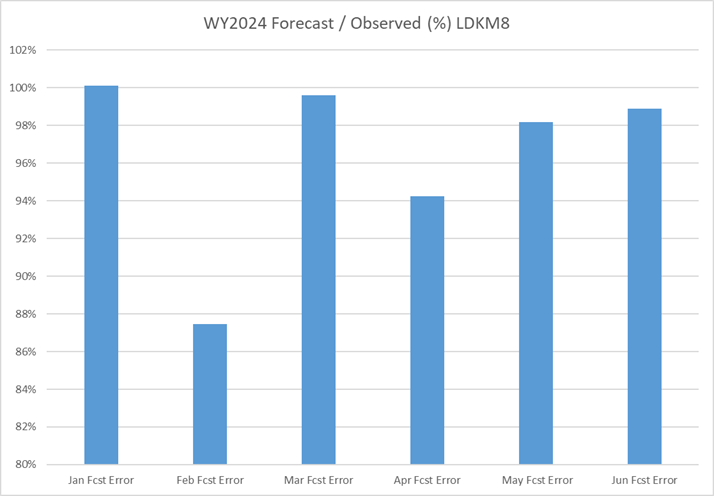
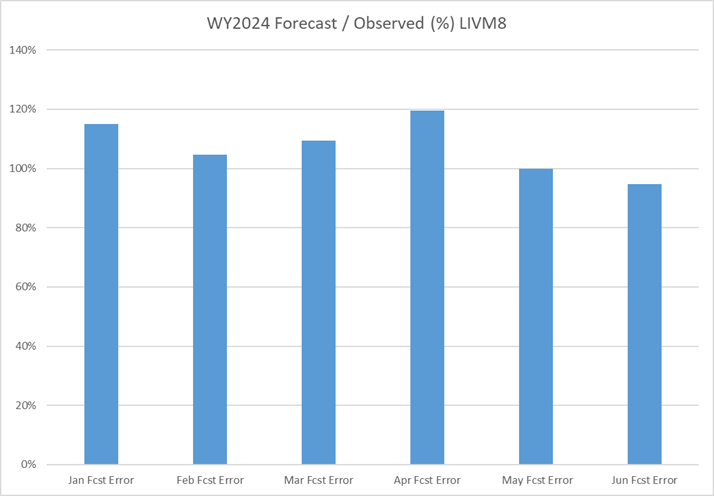
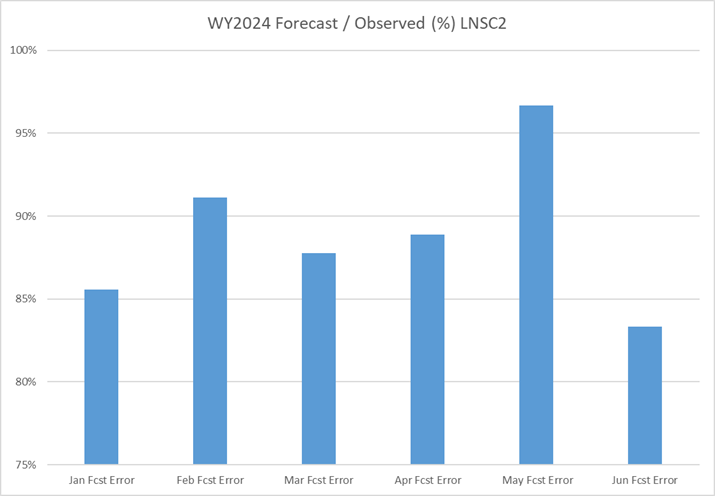
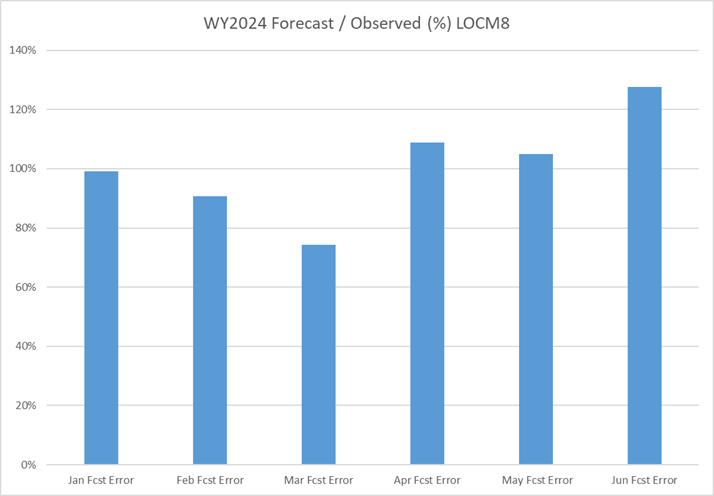
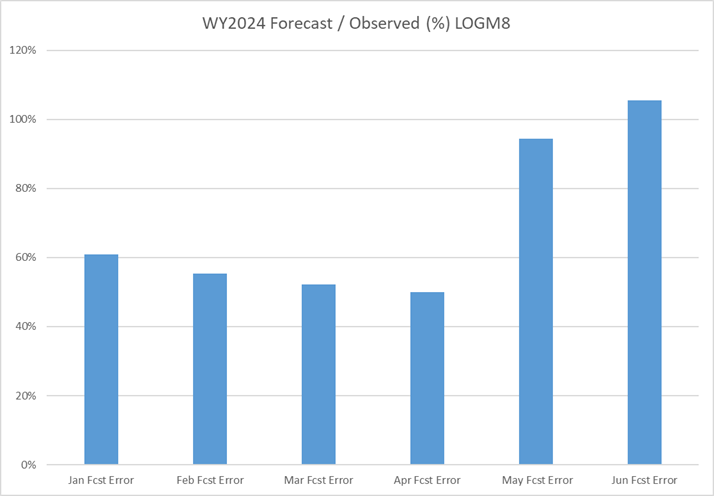
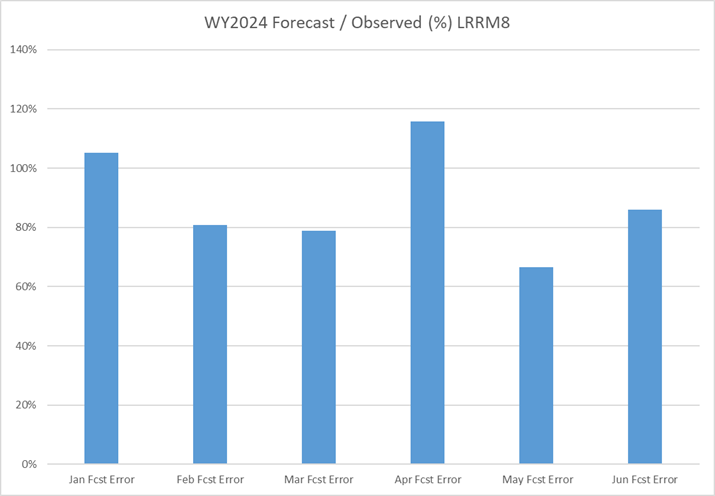
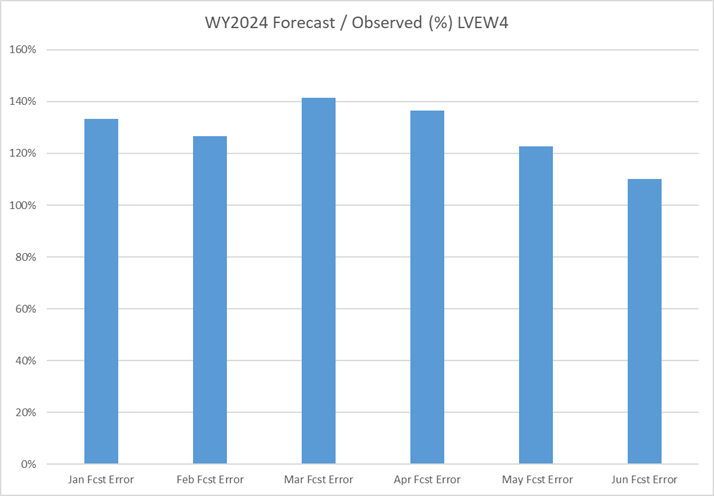
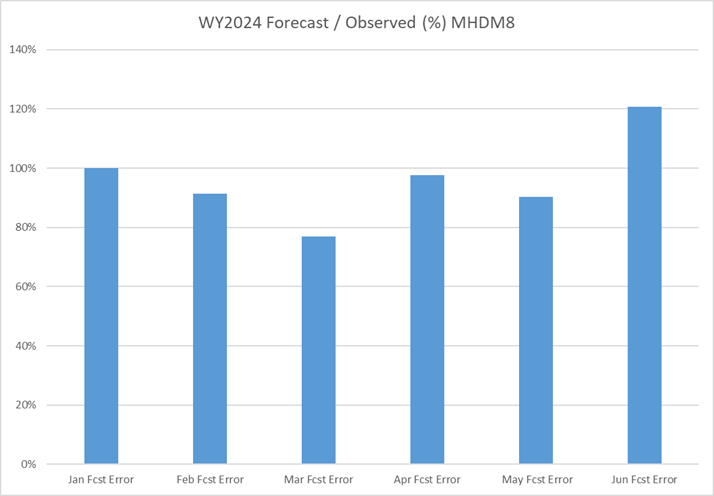
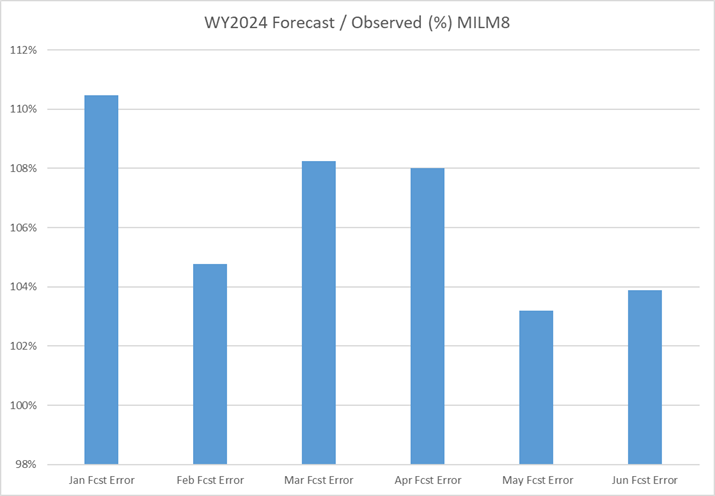
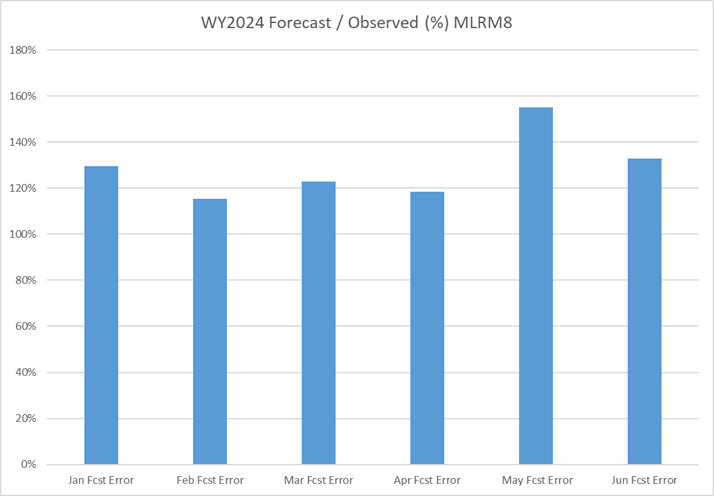
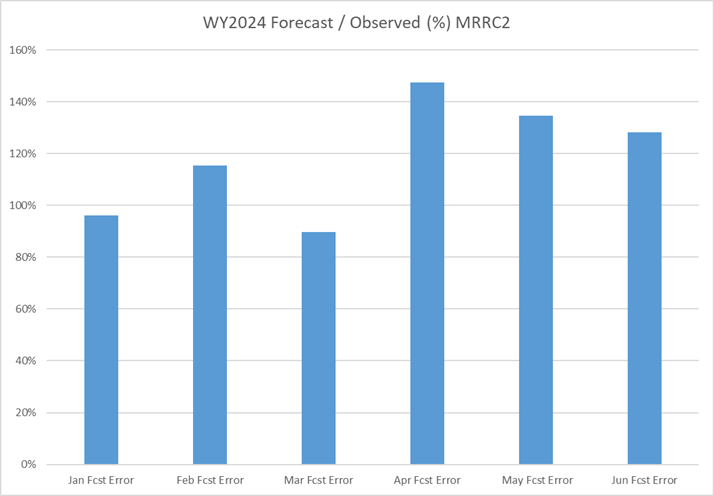
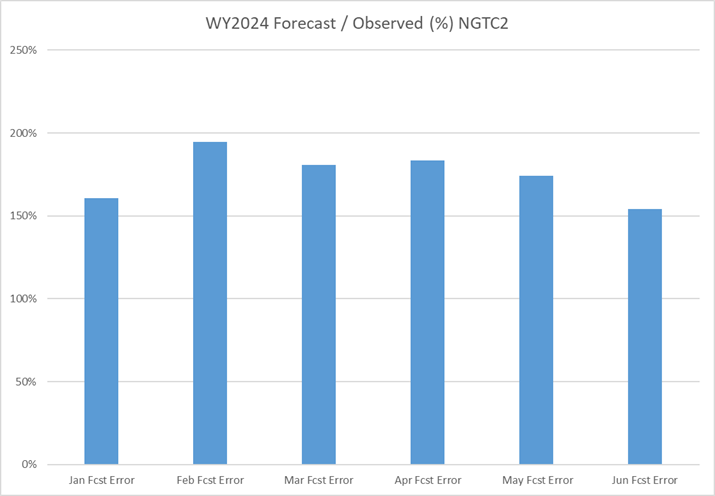
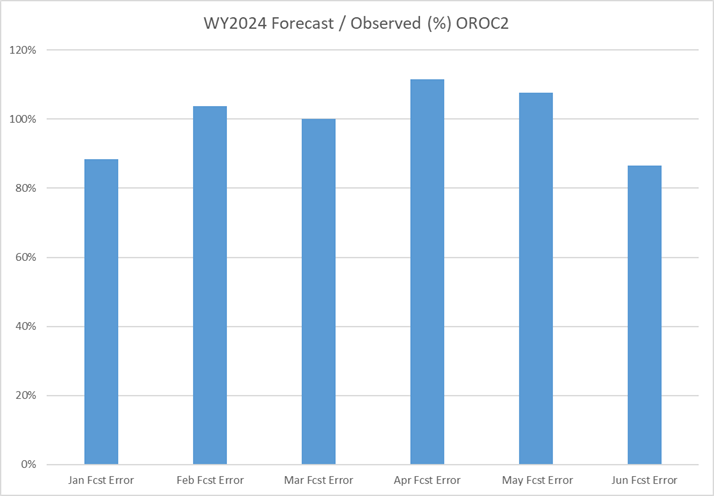
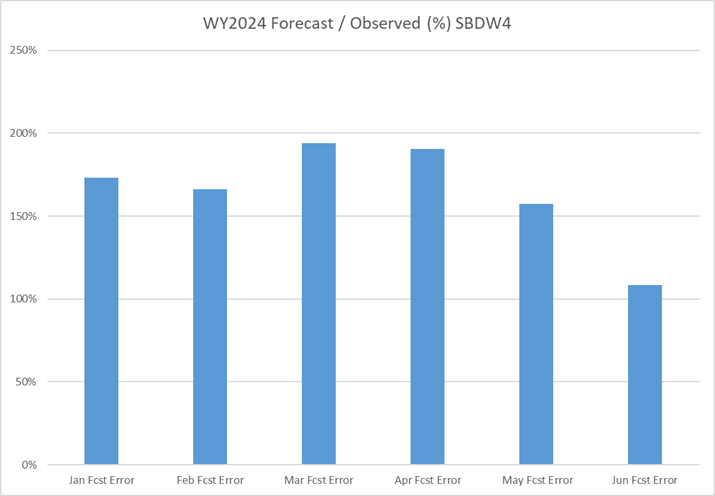
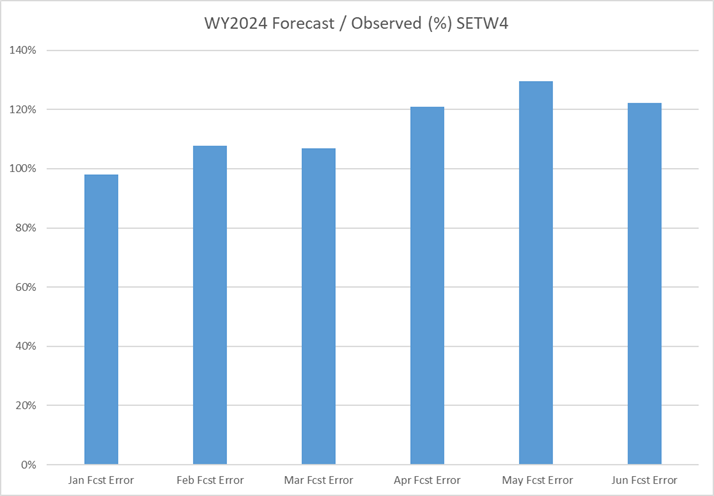
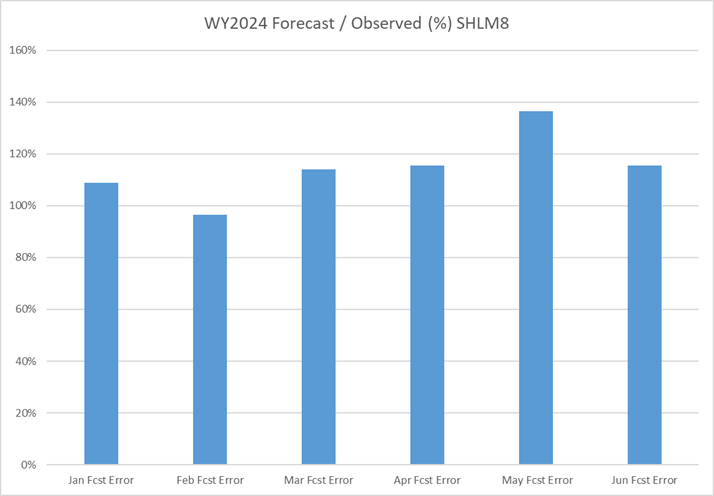
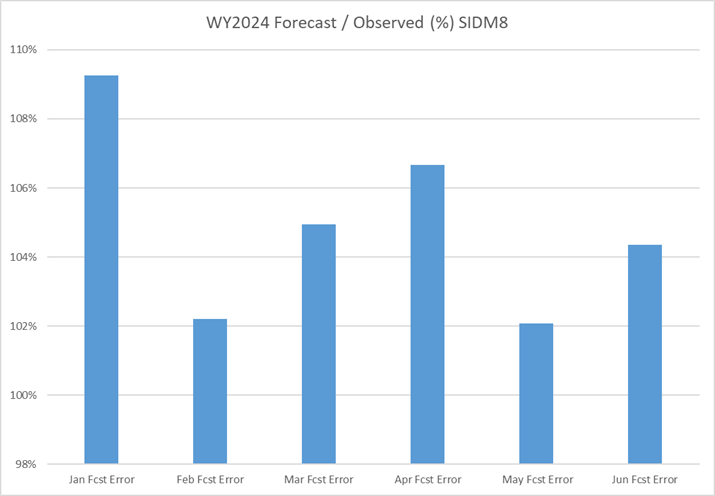
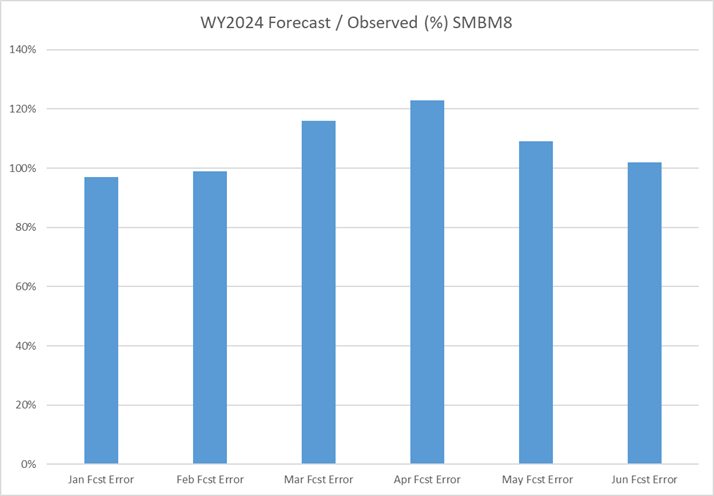
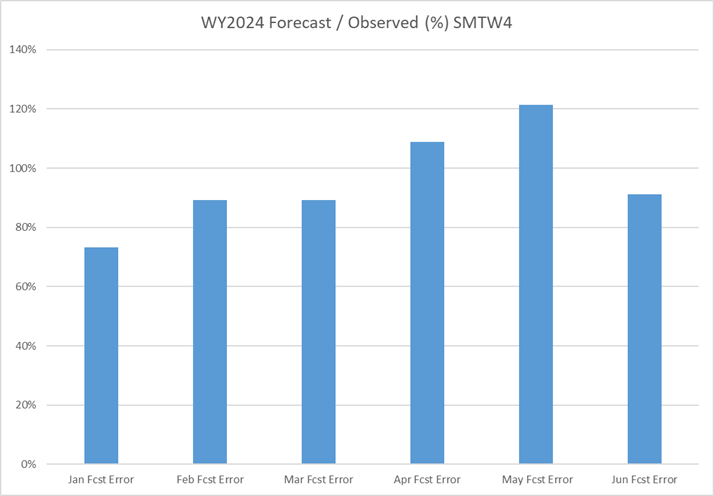
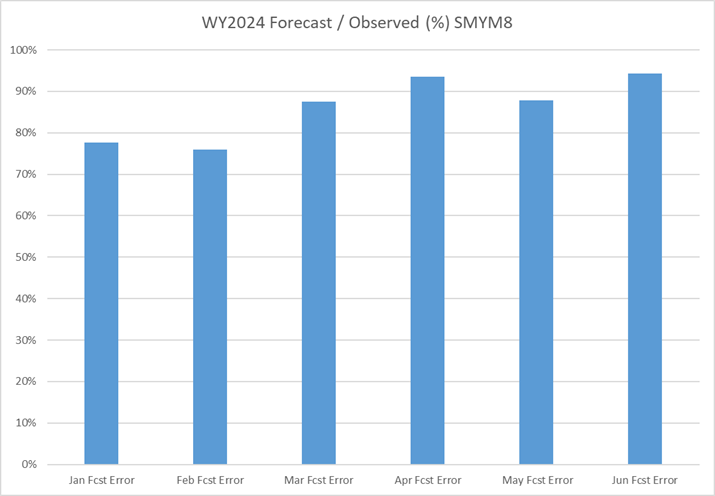
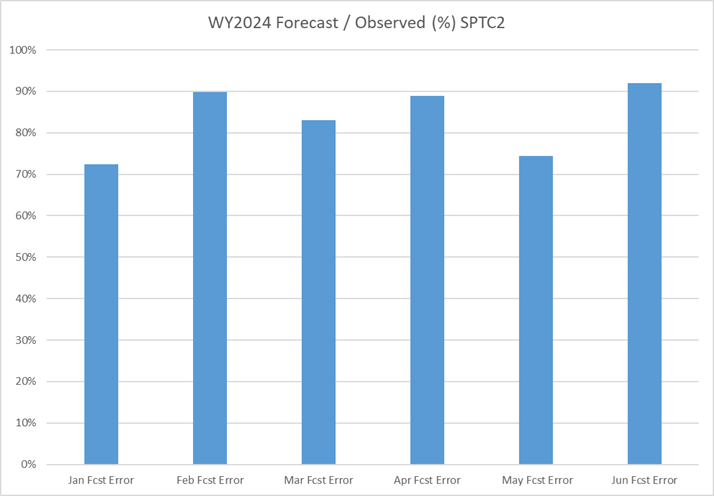
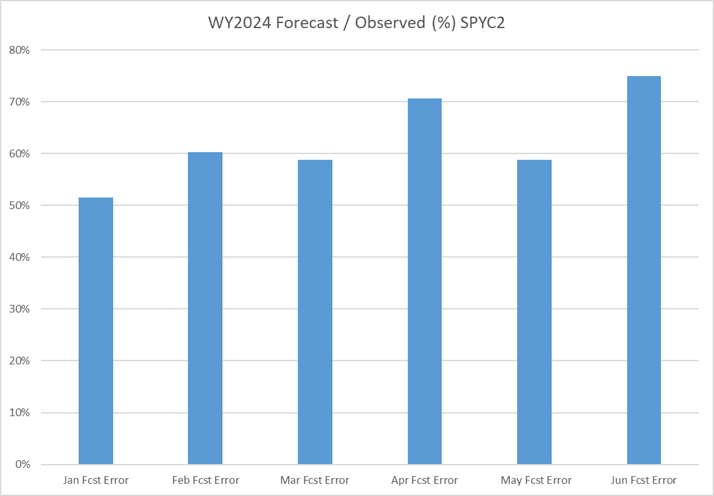
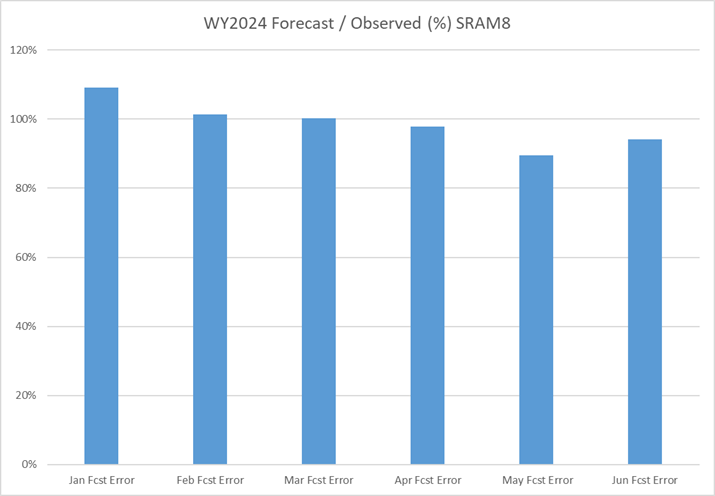
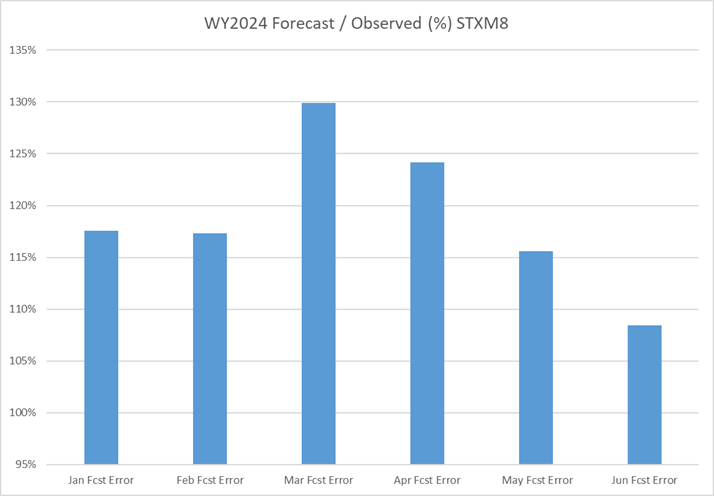
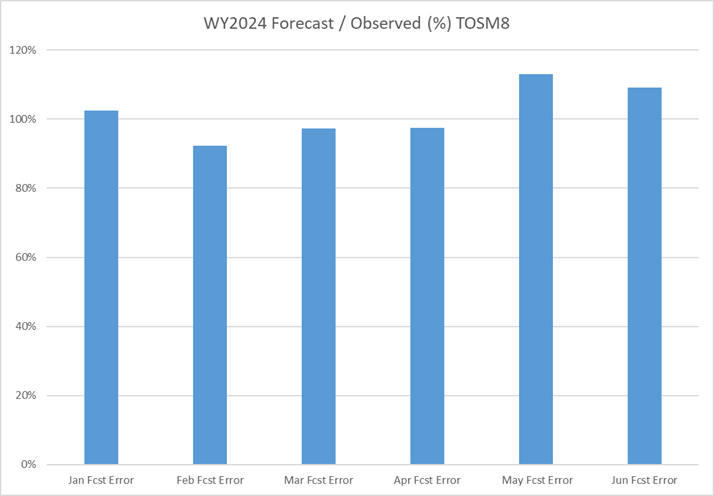
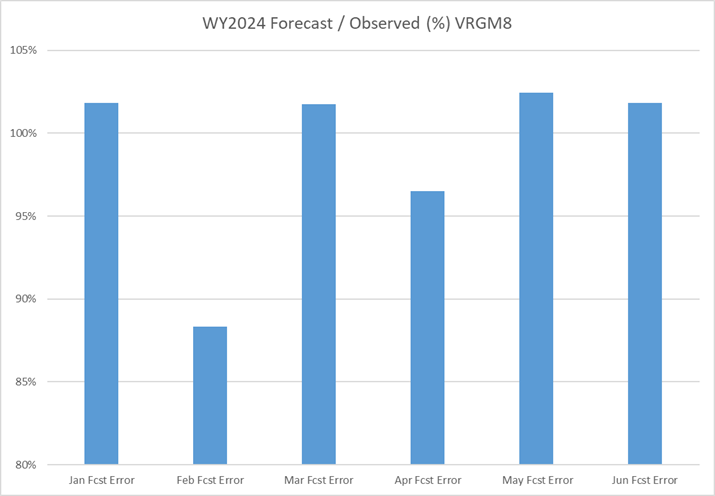
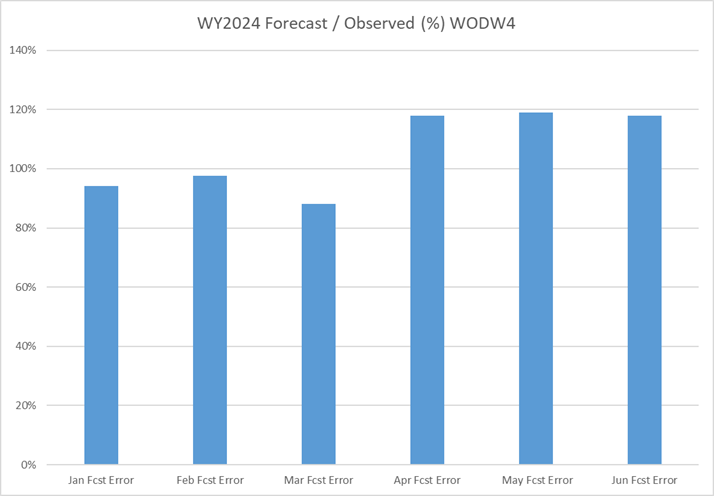
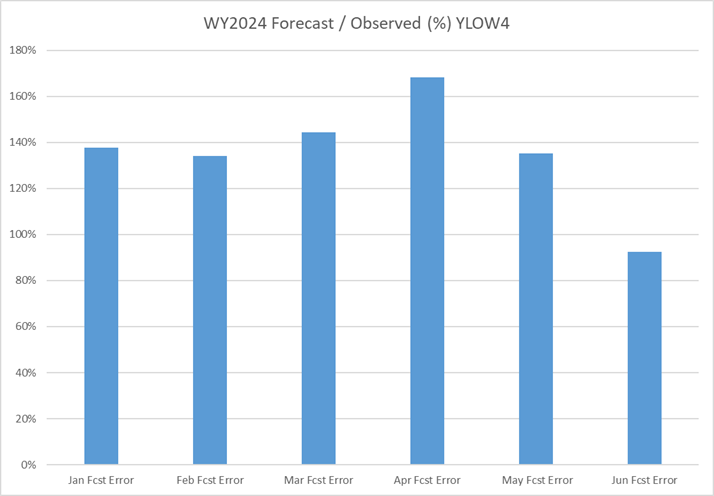
The following are water supply verification graphics that compare the forecasted April - September (seasonal) forecasted volumes to the observed volumes. Seasonal runoff volumes are forecast each January, February, March, April, May and June. The verification graphics are displayed as a percentage and are calculated as the Forecasted Volume / Observed Volume. For example 125% would mean that the forecasted volume for that forecast would be 25% more than what occurred, and similarly 75% would mean that the forecasted volume for that forecast would be 25% less than what occurred. |
| Individual Plots | ||
 |
 |
 |
 |
 |
 |
 |
 |
 |
 |
 |
 |
 |
 |
 |
 |
 |
 |
 |
 |
 |
 |
 |
 |
 |
 |
 |
 |
 |
 |
 |
 |
 |
 |
 |
 |
 |
 |
 |
 |
 |
 |
 |
 |
 |
 |
 |
 |
 |
 |
 |
 |
 |
 |
 |
 |
 |
US Dept of Commerce
National Oceanic and Atmospheric Administration
National Weather Service
Missouri Basin, Pleasant Hill
1803 North 7 Highway
Pleasant Hill, MO 64080-9421
Comments? Questions? Please Contact Us.

