It's been over 25 years since the historic July 12-15, 1995 heat wave that overwhelmed most of the Midwest, particularly the city of Chicago. A summary of its impacts:
Claimed over 500 lives in Chicago and hundreds more across the Midwest.
Highest temperature recorded for any Chicago area reporting station during this event was 106° at Midway Airport on July 13th. The only other documented higher temperature at any Chicago site on record was 109° at Midway Airport during the Dust Bowl in 1934.
Incredibly high dew points were observed (near or above 80°), and the combination of temperatures and dew points resulting in a peak heat index of 124-125°.
The 1995 event was a significant weather moment in Chicago’s history. Following the event, the National Weather Service (NWS) and the city of Chicago collaborated on developing a new impact based set of heat watch and warning criteria based on the impacts of the 1995 heat wave on human health. Warning communication and emergency coordination were also enhanced. The goal of this collaborative effort then and still today is to help protect life and property in future significant heat waves.
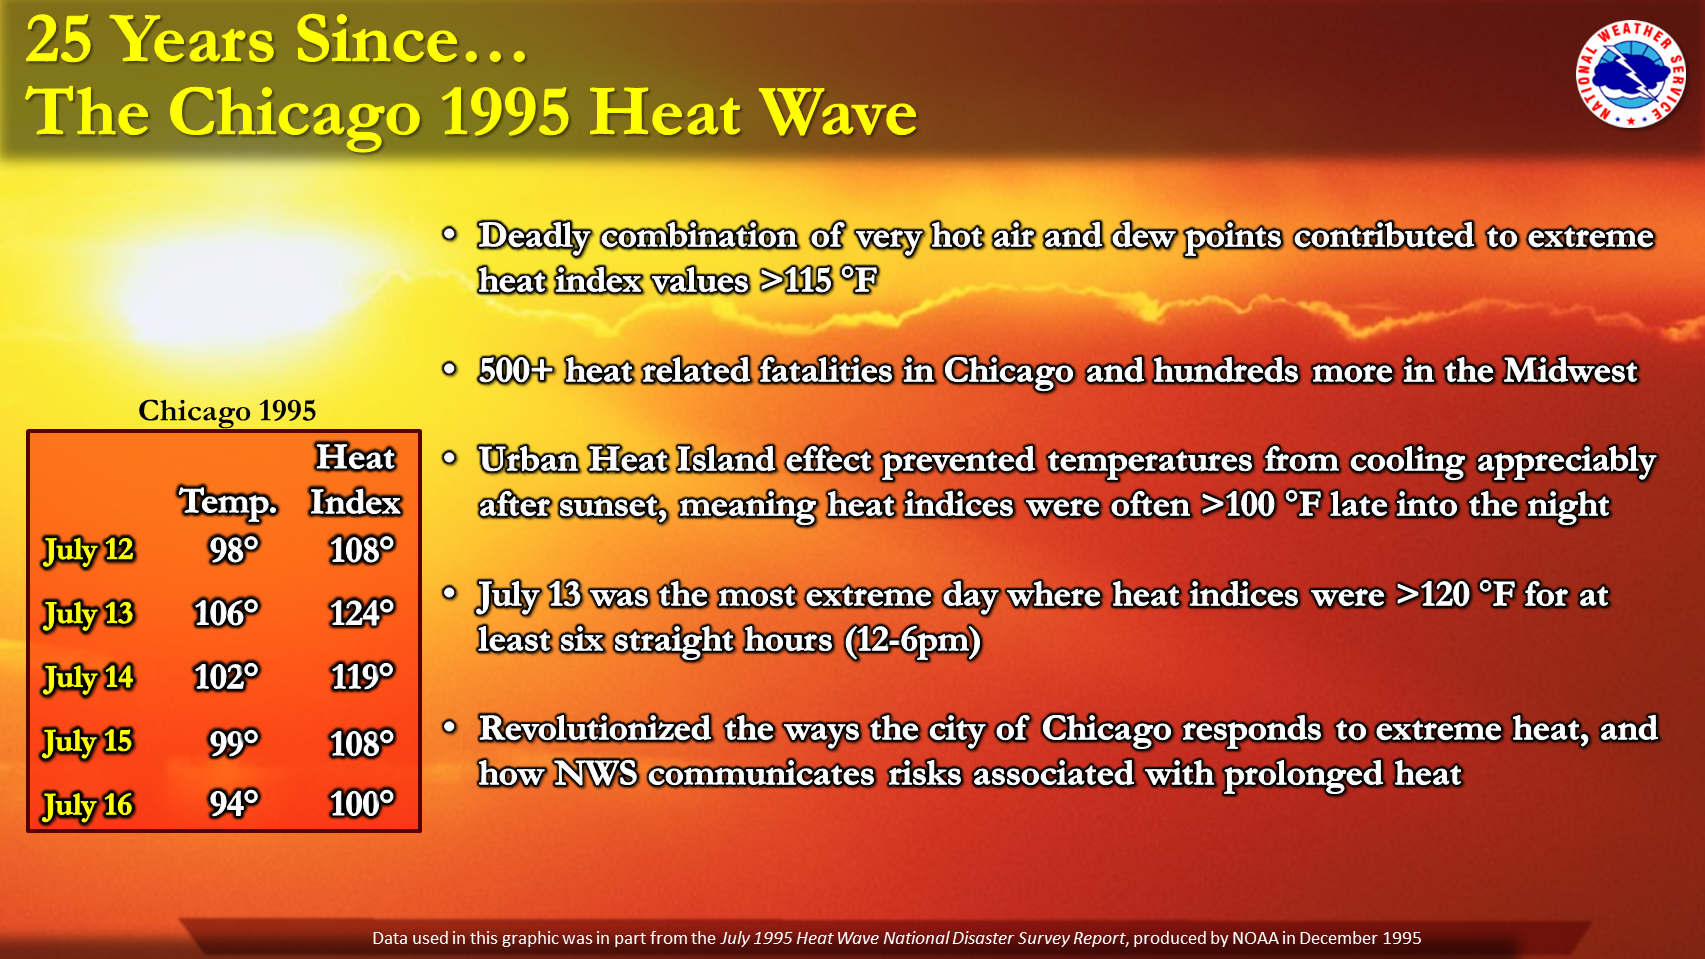
Figure 1: Summary of the July 1995 heat wave in Chicago.
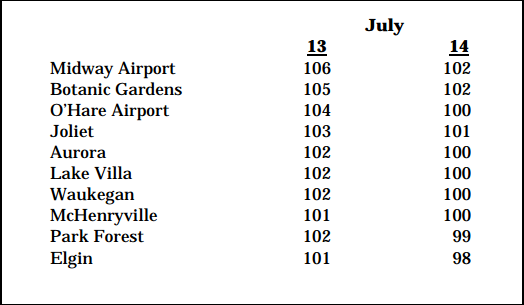
Figure 2: Maximum daytime temperatures (degrees Fahrenheit) at Chicago-area reporting stations July 13-14, 1995. Source: NOAA/NWS July 1995 National Disaster Survey Report
Meteorology
July 12-15, 1995, was dominated by an unseasonably hot and humid air mass that was slow to move out of the Midwest. An abnormal upper-level ridge and a dome of high pressure controlled the overall weather pattern that fateful week in July. Typically, upper-level ridging is associated with warmer temperatures beneath the ridge. On the evening of July 13, 1995 the upper-level ridge (Figs. 3-4) was centered over the upper Midwest. The resulting surface temperatures during the event were 10-20°F above average (Fig. 5).
Figure 3: 500 mb heights 7 PM CDT July 13, 1995. This chart reflects the broad upper high over the Midwest.
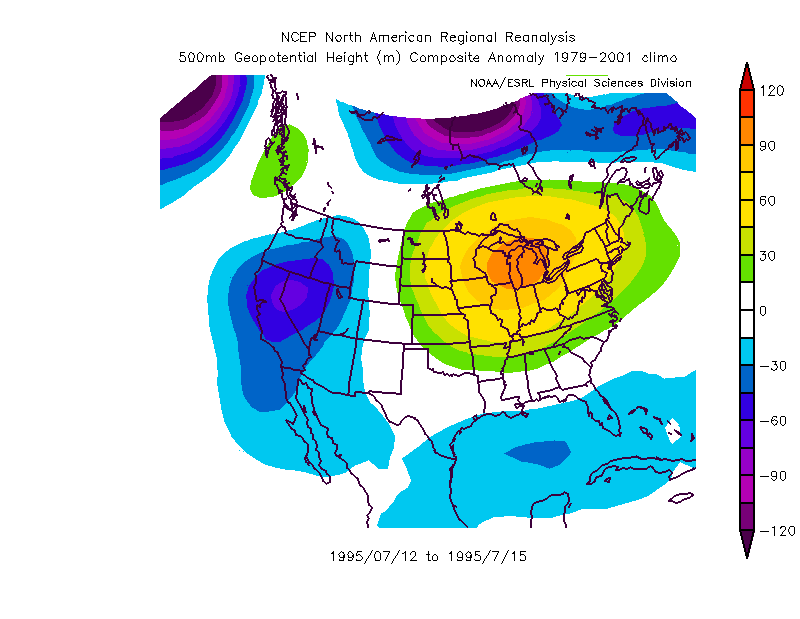
Figure 4: 500 mb height anomaly for the event. Large positive values (warm colors) indicate the above average upper-level ridge that was in place over the Midwest during the 1995 heat wave.
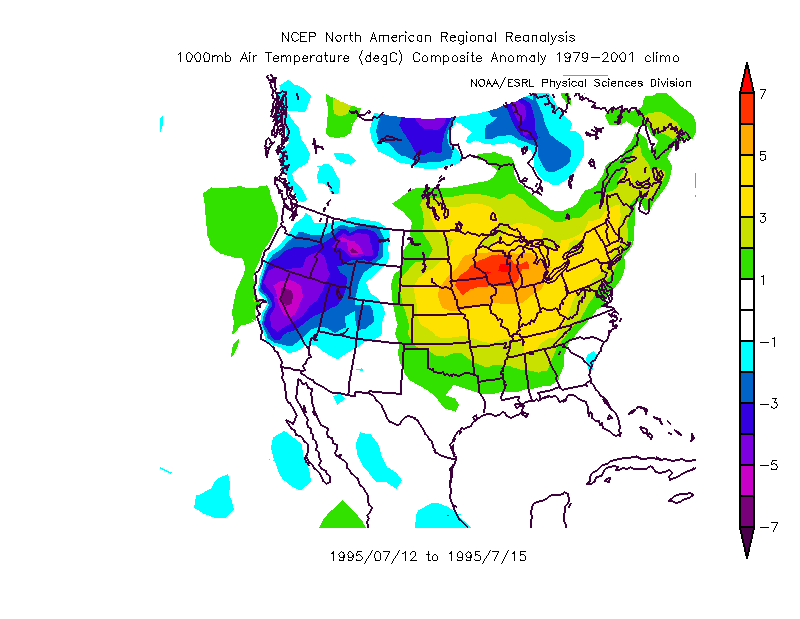
Figure 5: Near-surface air temperature anomaly in degrees Celsius. The warm colors (higher positive values) across the Midwest show that this event was marked by well above average air temperatures. Most of the upper Midwest experienced temperatures 15-20°F above average.
Southerly winds at the surface transported very humid air into the region; dew points consistently hit the upper 70s/lower 80s in the Chicago area, well above the average for July (Fig. 6). The subsequent hot, humid air mass in place during the heat wave resulted in extreme heat index values. These unseasonably high heat indices were the hallmark of the 1995 heat wave and contributed to the high number of casualties during the event.
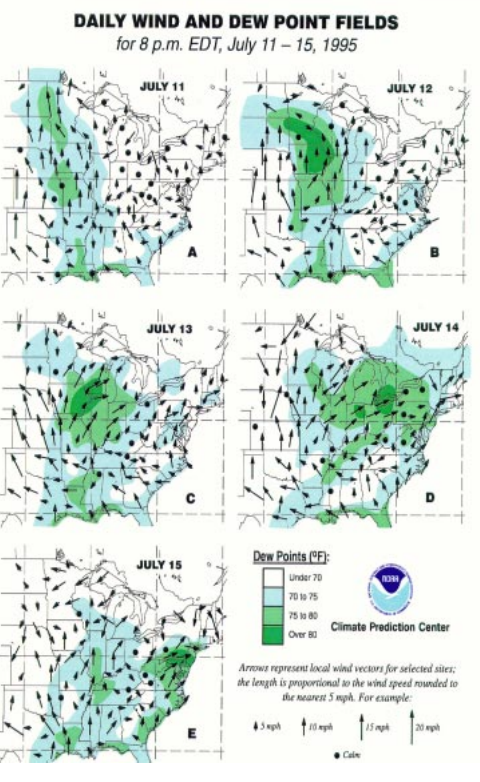
Figure 6: This figure highlights the transport of high humidity air into the Midwest. The high dew points yielded dangerously high heat indices across the area. Source: NOAA/NWS July 1995 National Disaster Survey Report
More on the meteorological diagnosis for this event can be found here.
Forecast Evolution
Technology has obviously evolved in the 25 years since the 1995 heat wave, but also have the knowledge of heat wave weather patterns and recognition of the ingredients of a significant one several days in advance, even a week or more at times. The increases in technology and computer power has contributed to vast improvements in our numerical weather prediction (NWP) models. Models today are highly sophisticated in how they model the atmosphere, especially compared with those in use in 1995. Additionally, contemporary high-resolution models account for the influences between land-atmosphere and ocean-atmosphere processes, further enhancing their utility in forecasting potential excessive heat episodes. The increased technology at forecasters disposal has proven tremendously useful to the forecast process in the 25 years since July 1995.
The analog technique is another highly useful forecasting tool that compares the forecast weather pattern and relevant parameters with past significant events. Analogs allow forecasters to look at previous high impact events to see how that event compares with the current forecast. Analogs can help a forecaster identify a potential significant weather event or a pattern conducive of significant weather well ahead of time that warrants monitoring.
Our ability to detect potential heat waves in advance has steadily improved over the past 20 years, especially with longer range (7-14 days) forecasts. The Climate Prediction Center issues 6-10 day, 8-14 day, and 30 day temperature and precipitation outlooks. These outlooks are updated frequently and highlight the current thinking regarding the long-range weather pattern. Such information can increase awareness and lead-time regarding potential heat waves. This information can help you better prepare for any potential abnormal weather.
Historical Context
A paper published in the Bulletin of the American Meteorological Society found that the 1995 Chicago heat wave was not an unprecedented event in Chicago’s history, at least in terms of maximum high temperatures. The authors noted that heat waves in 1911, 1916, 1934, and 1936 were of comparable (or greater) intensity. How does the 1995 heat wave compare to recent significant heat waves, particularly July 29-31, 1999 and July 4-7, 2012?
The heat wave that affected the Chicago area July 29-31, 1999, was eerily similar to the 1995 event with uncomfortably high dew point temperatures affecting Chicagoland. Dew points soared into the upper 70s and lower 80s, peaking at 82°F at both Midway and O’Hare Airports. The resulting dangerous heat indices of 119°F at Midway and 113°F at O’Hare occurred on both July 29-30. The peak high temperatures during the 1999 event occurred July 30 when Midway and O’Hare hit 103°F and 100°F, respectively.
One major factor that influenced the severity of both the 1995 and 1999 heat waves was the urban heat island effect (click here for more information about urban heat islands). Temperatures at Midway Airport were generally on the order of 1-2 degrees warmer than O'Hare during daytime peak heating, possibly due to urban heat island effects since Midway is more closely situated in the Chicago urban heat island area (concrete, buildings, etc.) than O'Hare. Additionally, the rate of overnight cooling in urban areas is much less pronounced than surrounding areas due to the urban heat island. Such was the case in 1995 and 1999 with overnight lows in the upper 70s to lower 80s offering no respite for those afflicted by the maximum daytime heat and humidity. Increased heat awareness following the 1995 heat wave helped alleviate significant impacts during the 1999 heat wave.
More recently, Chicago experienced a heat wave that was warmer than previous heat waves, including the 1995 heat wave. Maximum high temperatures through July 4-7, 2012 were generally a few degrees higher than 1995 or 1999 (Fig. 7).
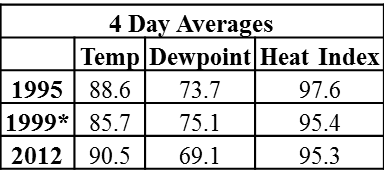
Figure 7: Four day average temperature, dew point, and heat index in degrees Fahrenheit. 1999 is a 3 day average.
In fact, July 4-6 was the second warmest 3-day period in Chicago history. Average high temperatures during this period were 91.4°F, trailing only the 3-day period July 28-30, 1947! However, unlike the 1995 and 1999 heat waves the dew point temperatures were considerably lower in 2012 (Fig. 7). Thus, the resulting heat indices for 2012 were far less impactful than previous heat waves (Figs. 8-9). However, this heat wave and subsequent lack of rainfall and above average July temperatures contributed to the extensive drought in the Midwest in July 2012 and impacted agriculture throughout the region (Drought at start of July; at end of July).
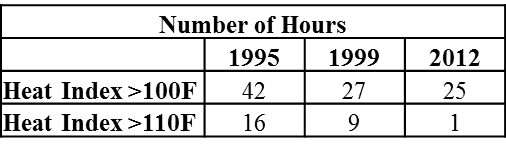
Figure 8: Number of hours with a heat index greater than 100°F and greater than 110°F for each event.
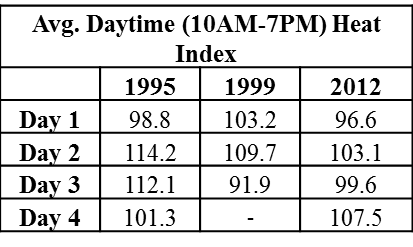
Figure 9: Average daytime heat index in degrees Fahrenheit.
Call to Action: Be a Force of Nature
Following the 1995 heat wave, the Chicago NWS office and the City of Chicago worked together to develop an impact-based excessive heat criteria specific to the city of Chicago to enhance the warning communication for future events:
These criteria recognize that the human body’s ability to properly deal with heat index values dramatically decreases as the heat index rises. In general, heat indices between 95°F and 105°F can be tolerated with appropriate precautions, but when heat indices exceed 105°F the ability of the body to keep its internal temperature regulated decreases. Heat index values up to 115°F (or higher) can have significant health impacts on otherwise healthy individuals (see heat tips below). In an effort to mitigate potential health and commercial impacts, NWS Chicago will issue a heat watch, as conditions permit, if the forecaster believes that there is a good chance the heat criteria will be met within a couple of days following the initial forecast. Should it appear that the criteria are likely to be met with high forecaster confidence, a heat warning will be issued. The City of Chicago will then mobilize for a potential heat emergency; upon issuance of a heat warning, the city will fully implement its emergency response plan.
The NWS and public safety partners have many more ways to communicate threats now than in 1995. Ahead of potentially high impacting weather events, the NWS can now message the potential in a variety of ways to a larger audience and can do that even in advance of watches and warnings. The NWS does this via briefings to core partners and forecast graphics (such as the Weather Stories) that are easily consumable and easily shared for instance on social media. These far-reaching means of conveying hazard potential can reach a larger audience, and messaging the threats to specific vulnerable groups can now be done too. This is where collaboration with the City of Chicago is especially important.
Unlike other forms of extreme weather, heat waves do not possess telltale signs of impending hazards. Severe thunderstorms produce dangerous weather phenomenon (tornadoes, lightning, hail, etc.) that are easily identified as harmful. Heat waves, however, are often accompanied with sunny skies and relatively benign weather - light winds, no rain, etc. Despite this, heat waves are exceedingly dangerous and should be treated with proper precautions. The collaborative efforts of the NWS, local governments, emergency managers, broadcast media, and you serve to increase public awareness when excessive heat is forecast and prompt others to take precautions. You are a key part of this effort. In order to successfully mitigate the potential hazards of heat waves, and other extreme weather, you can be a force of nature by knowing your risk, taking action, and being an example in your community.
Know your risk
Take action
Be an example
To learn more about how you can be a force of nature, visit Weather Ready Nation.
General Heat Safety Preparedness Tips
Excessive heat is extremely dangerous; a little preparedness can go a long way to protecting yourself and others. What can you do?
A heat preparedness and safety page from NWS Chicago can be found here.
For more detailed information on what to do before, during, and after periods of excessive heat, please visit Ready.gov and the Center for Disease Control and Prevention websites.
If you’re interested in learning more:


 Follow us on YouTube