 |
Historical Independence Day Weather | |
| Louisville | Lexington | Bowling Green | Frankfort | |
| Highest Temperature | 102° in 2012 and 1911 | 99° in 2012 | 102° in 2012 | 100° in 1934 |
| Highest Average Temperature | 89° in 2012 and 1911 | 86° in 1921 | 89° in 1897 | 85.5° in 1934 |
| Lowest Temperature | 51° in 1968 | 50° in 1968 | 52° in 1924 and 1907 | 49° in 1968 |
| Lowest Average Temperature | 65° in 1968 | 63.5° in 1909 | 67° in 1972 and 1924 | 62° in 1968 |
| Wettest | 5.04" in 1896 | 1.83" in 1935 | 2.40" in 1941 | 2.60" in 1925 |
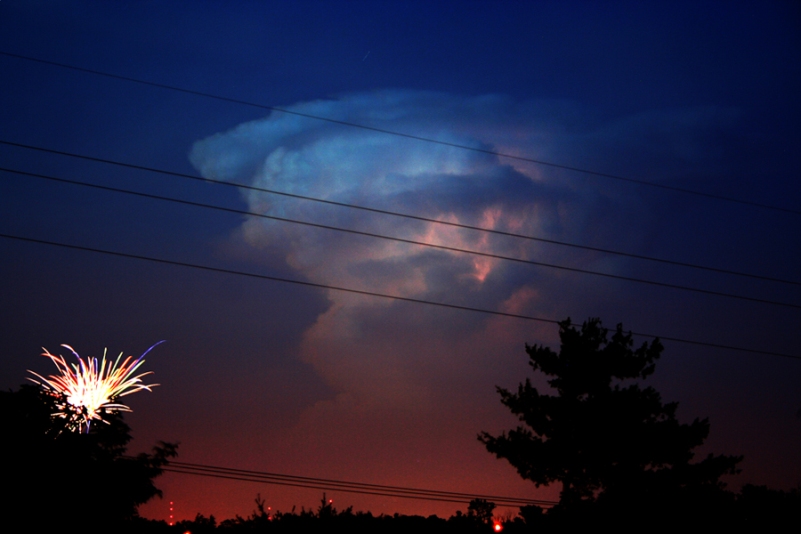
Natural and man-made fireworks north of Lexington on May 30, 2010. Photo: John Bradshaw
Note on the data presented here:
At Bowling Green and Frankfort, data presented here may differ from data presented elsewhere. That is due primarily to "time shifting," which is when observers give their 24-hour reports at 7am. The high temperature, for example, may be given by the observer as 80 degrees on the 7am report on June 1, meaning that the 80 degree reading actually happened on the calendar day of May 31 (the previous afternoon). Unfortunately, that high temperature may have gone into the climatological record as having happened on June 1, since that is the date of the report. Additionally, data may be time shifted for only a portion of a location's history.
An additional problem at Bowling Green is that there have been many observers over the years, occasionally simultaneously, and a difference can arise depending on which observer's data are used.
These issues are not present at Louisville and Lexington.


 Weather Story
 Weather Map
 Local Radar
 Follow us on YouTube