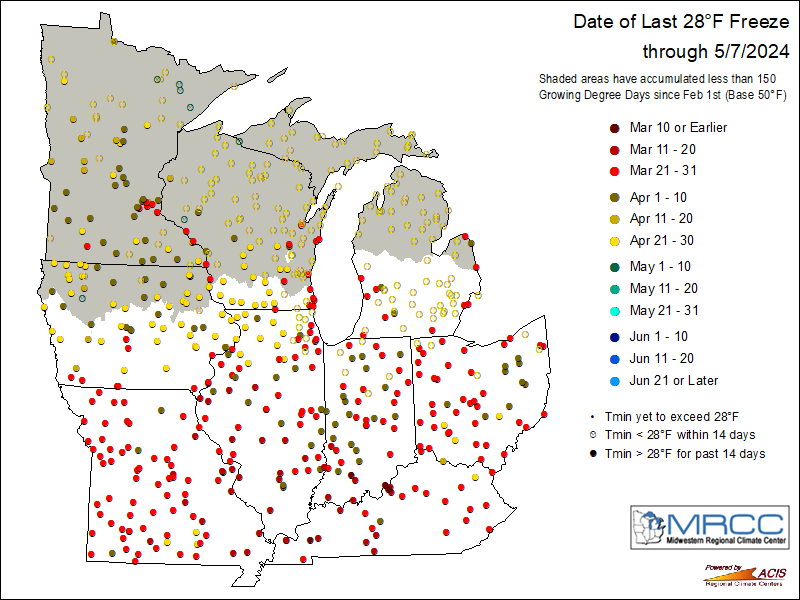
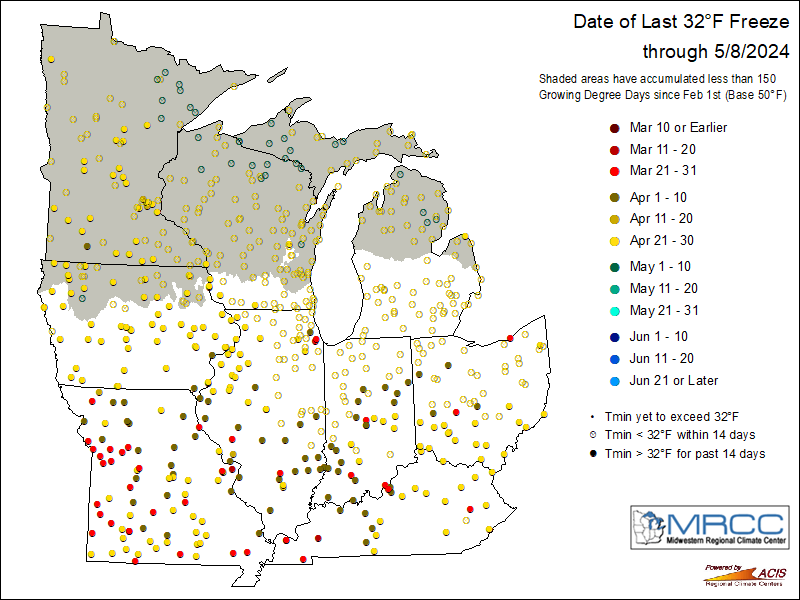
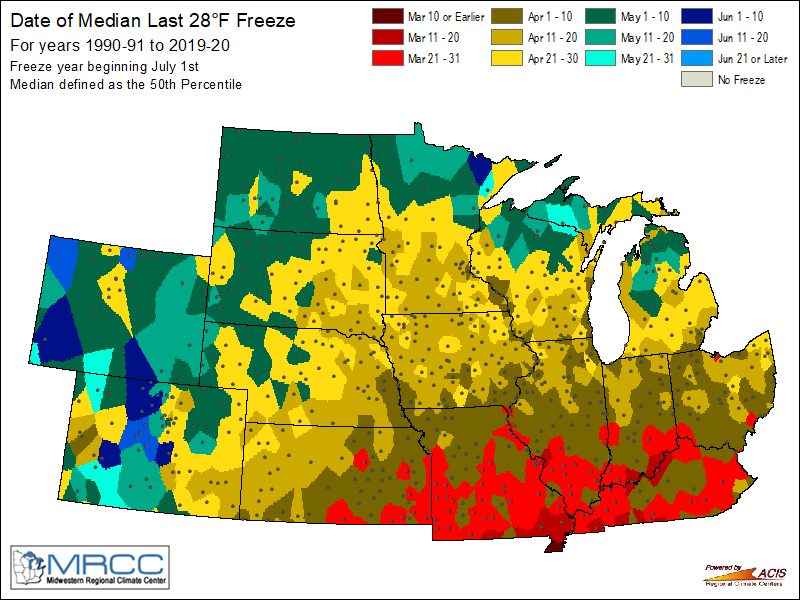
Growing season is almost underway across the area and it's that time of year when crops/fruit trees/gardens and other vegetation could become susceptible to the possibility for frost and near freezing temperatures at night. Typically, frost can occur when the temperature falls below 36°F, especially in rural areas. It is a localized phenomena and can be quite variable across a small area. While the National Weather Service does not keep track of "frost" in observations per se, we do keep track of when temperatures hit the freezing mark or fall below. Frost becomes more widespread when the temperature falls below 32°F with some freeze possible. A hard freeze is possible when temperatures fall below 28°F. The maps below, courtesy of the Midwestern Regional Climate Center, show dates for various spring freeze parameters. Click on the images for a larger resolution or see additional maps here.
 |
 |
 |
 |
The tables below utilize data from the MRCC's Freeze Date Tool. Explore the tool here. Average dates below are county-based (noted in italics). Earliest and latest dates, along with the indicated period of record, are noted from the specific climate site (city noted in bold).
|
32° Freeze (at or below 32°F) |
||||
| Location | Average Last Date | Earliest Late Date | Latest Date | Record Period |
|
Benton Harbor Berrien Co., MI |
April 28 | March 30 (1941) | June 22 (1922) | 1890-present |
|
Defiance, OH Defiance Co., OH |
April 25 | April 13 (2011) | May 12 (2009) | 1998-present |
|
Fort Wayne Allen Co., IN |
April 25 |
April 1 (1922) |
May 27 (1961) |
1912-present |
|
Goshen, IN Elkhart Co., IN |
April 29 | April 17 (2007) | May 21 (2002) | 1997-present |
|
Lima, OH Allen Co., OH |
April 25 | April 3 (2011) | May 19 (2002) | 1998-present |
|
South Bend St. Joseph Co., IN |
April 29 | April 7 (1984) | May 29 (1897) | 1893-present |
|
28° Freeze (at or below 28°F) |
||||
| Location | Average Last Date | Earliest Last Date | Latest Date | Record Period |
|
Benton Harbor Berrien Co., MI |
April 13 | March 17 (1929) | May 28 (1992) | 1890-present |
|
Defiance, OH Defiance Co., OH |
April 12 | March 30 (1999) | May 4 (2005) | 1998-present |
|
Fort Wayne Allen Co., IN |
April 12 |
March 10 (1929) |
May 13 (1946) | 1912-present |
|
Goshen, IN Elkhart Co., IN |
April 15 | March 27 (2010) | May 4 (2010) | 1997-present |
|
Lima, OH Allen Co., OH |
April 10 | March 18 (2005) | April 26 (2006) | 1998-present |
|
South Bend St. Joseph Co., IN |
April 15 | March 18 (1980) | May 25 (1925) | 1893-present |
These maps will be updated with the start of growing season
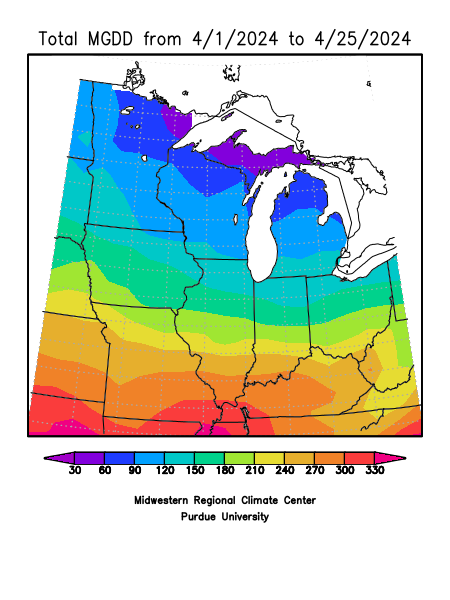
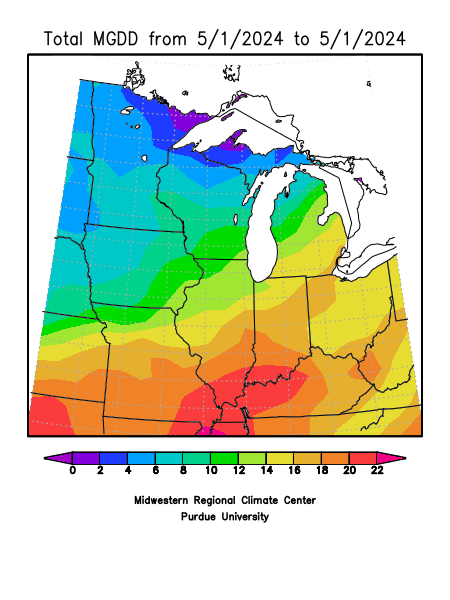
Modified Growing Degree Days are similar to Growing Degree Days with several temperature adjustments. If the daily maximum temperature is above 86°F, it is reset to 86°F. If the daily minimum temperature is below 50°F, it is reset to 50°F. Once the max/min temperatures have been modified (if needed), the average temperature for the day is computed and compared with a base temperature, which is usually 50°F for corn and soybeans. Modified Growing Degree Days are typically used to monitor the development of corn, the assumption being that development is limited once the temperature exceeds 86°F or falls below 50°F. For example, if the high for the day was 92°F and the low 68°F, the average for use in the Modified GDD calculation would be 86 + 68 = 154 / 2 = 77. Click on the maps below to go to the most recent versions of the data from Midwestern Regional Climate Center.
|
Season to Date This map shows the total growing degree days since start of the growing season. The start of the season is defined as April 1. |
Month to Date This map shows the total growing degree days since start of the month. |
 |
 |
 |
 |
|
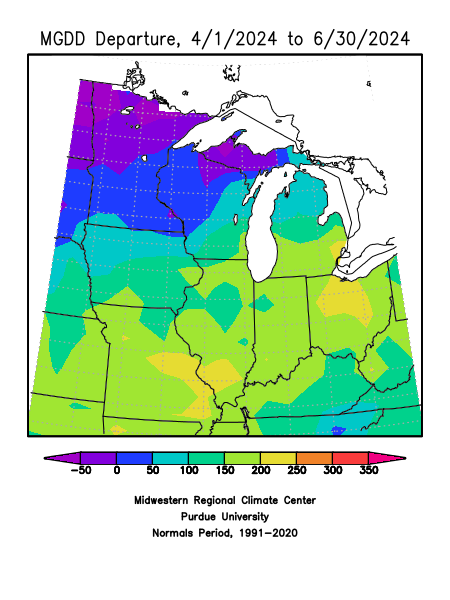
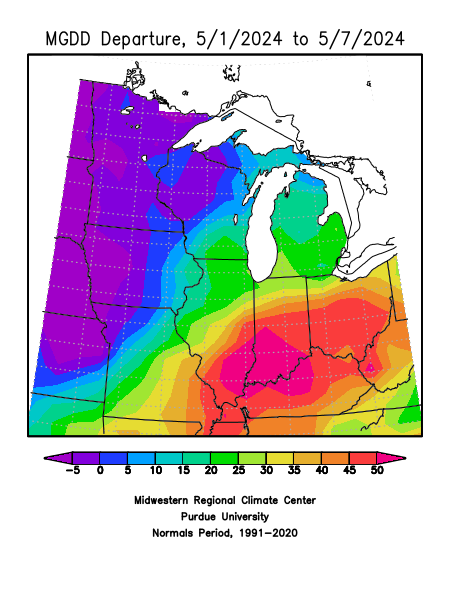
Month Departure from Normal |
Season Departure from Normal |
Updated 4/14/2024 -KB

