|
|
How warm/cool/wet/dry will it be this summer/fall/winter/spring?
You can quickly get an idea of such likelihoods by accessing the 3-month (90-day or seasonal) outlooks from the Climate Prediction Center (CPC), which are routinely provided up to nearly a year in advance! Follow these steps to view the 3-month forecast:
 |
 |
For an example of how to interpret CPC images, click here.
Did you know CPC provides other outlooks including 6-10 day, 8-14 day, and monthly periods? Check them out here: http://www.cpc.ncep.noaa.gov/
What determines an El Niño or La Niña?
First, it is important to know that the Oceanic Niño Index (ONI) used in the process is a calculation of the 3-month average sea surface temperature (SST) in the Niño 3.4 region of the eastern Pacific (better captures the change to each phase).

To have an El Niño phase there must be the following:
Contrastingly, a La Niña must have:
See examples of both phases in the graphic below of average SST (top maps) and departure from normal (bottom):
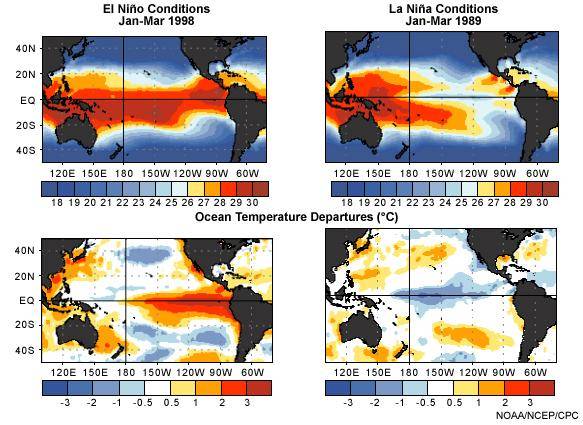
For the El Niño conditions on the left - note the clear signal of above normal SST values across the central and eastern portions of the tropical Pacific.
For the La Niña conditions on the right - note the contrastingly different signal of below normal SST values across the central and eastern portions of the tropical Pacific.
El Niño and La Niña events typically occur every 3-5 years, with the interval between events varying anywhere from 2-7 years. While El Niño episodes usually last up to 12-18 months, La Niña episodes are typically shorter and last approximately 9-12 months.
So what is our current status? Go to this link to see a table of ONI values including the current value (at bottom of table) and all the previous values since 1950. The values of -0.5 or less are highlighted in blue and values of 0.5 or more are in red, while the other values closer to 0.0 are supportive of neutral phases.
What does El Niño/La Niña mean for Georgia?
The atmosphere responds differently between El Niño and La Niña events due to the change in available heat energy across the tropical Pacific. This response tends to affect the positioning of the jet stream and areas of high or low pressure. The typical weather patterns that result in both types of events are more apparent during the wintertime and are shown in the graphics below.
You can see above that during an El Niño, the southern portion of Georgia is typically wetter and cooler than normal due to frequent storm tracks along the subtropical Pacific jet stream (marked by the red arrow).
Whereas, during a La Niña, Georgia is typically warmer than normal and the southern portion is typically abnormally dry.
Of course, there are exceptions to these patterns during the season and it’s important to remember that no single weather event can be tied to either an El Niño or La Niña phase.
You should also keep in mind that other factors may influence the large-scale circulations and weather patterns, contributing to the climate variability for a particular period. One such factor is the Artic Oscillation (AO). The AO is a pattern in which atmospheric pressure at polar and middle latitudes fluctuates between negative and positive phases.
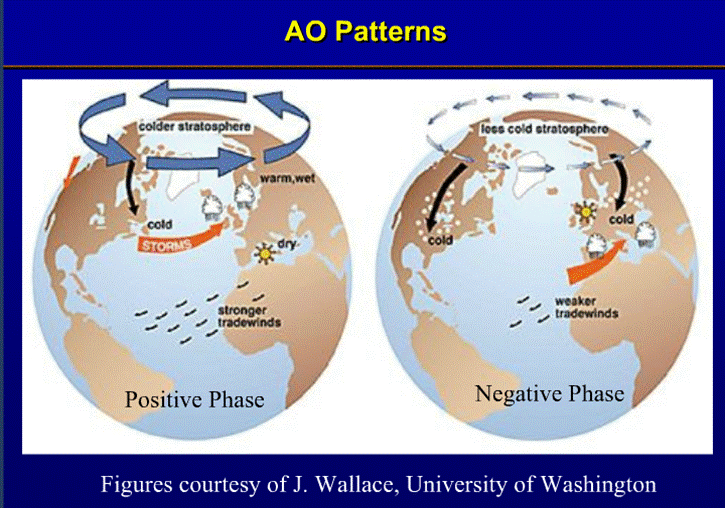
Positive phases tend to keep colder air closer to the high latitudes, while a negative phase usually means colder air is making surges farther southward. Such a difference in phase can contribute toward the difference between a snowy or rainy El Niño/La Niña for certain areas. Graphs of the AO index values from 1950 to the present can be accessed here.
During periods where there is a neutral phase of El Niño or La Niña events and related climate impacts are less evident with potentially more average conditions, other smaller scale examples of climate variability including the AO become more significant in providing outlooks for future conditions. Skill in such outlooks tend to be limited to nearly 2 weeks out, therefore there is usually more uncertainty in climate outlooks during neutral conditions.
Looking for specific AO values? Here's a chart of all the specific monthly mean values since January of 1950.
How about the AO outlook? Here's the latest ensemble mean from GFS model guidance up to 14 days out.
What is the average temperature or precipitation amount on a particular day for a specific location?
You can quickly access archived local climate data from not only the local airports, but also many of the cooperative observer sites across north and central Georgia. These sites help make up the climate data network and are quality controlled by the National Climatic Data Center (NCDC) to become official climate data. Get started by going to NOWData on our website.
You’ll see our NOWData lookup tool (NOAA Online Weather Data):
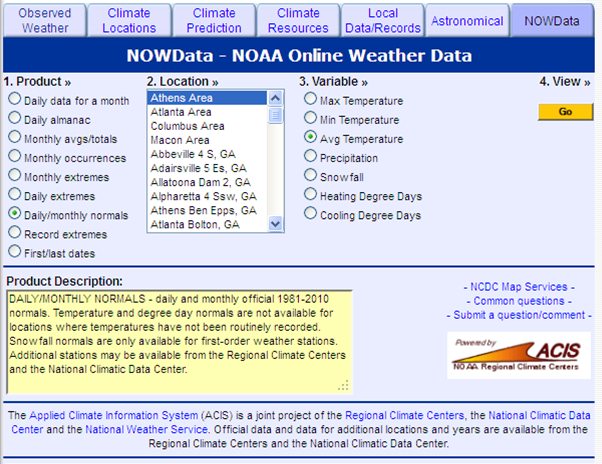
For average daily values for a particular location, simply (1) select “Daily/monthly normals”, (2) your location of interest, (3) the particular type of data, and (4) click “Go”! You will have a separate window pop up with specific daily and monthly normal amounts for the entire year!
There are many other types of specific climate data from the various products listed on the left selection menu with this tool, so play around and check them out – you may discover all kinds of interesting information near where you live!
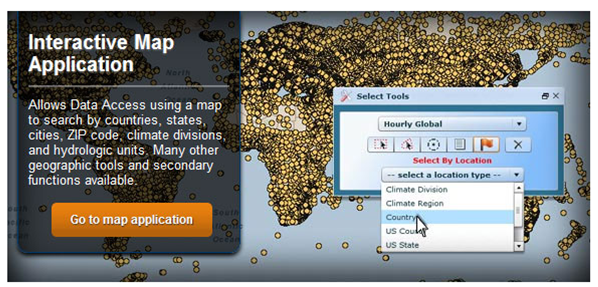
How do I navigate the National Climatic Data Center's (NCDC) webpage?
There is a multitude of information available from the National Climatic Data Center (NCDC), so it can be easy to feel overwhelmed and not know where to go to the get information you want. Here are some quick ways to get access to common data from NCDC’s webpage.
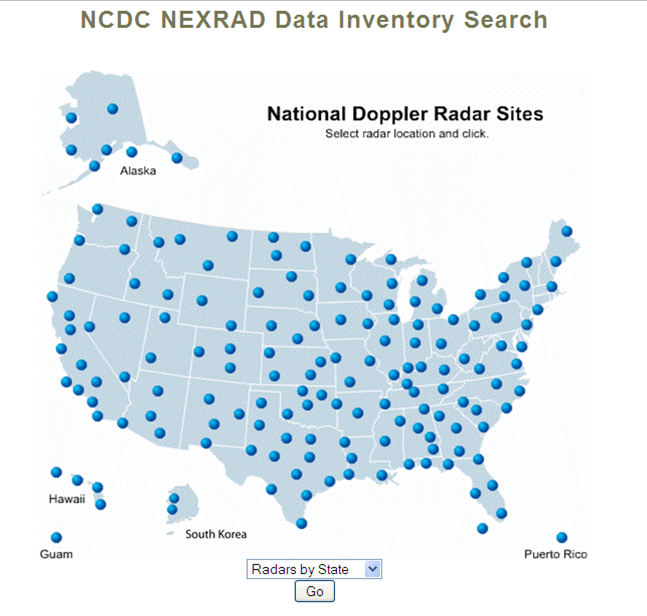
Of course, there are many other examples of data that are available through the NCDC website. Other data types include satellite, marine/ocean, severe weather, extreme events, etc. Not all of the data are free (as the examples provided above), and you may be required to provide some type of fee. If you have any questions on the best way to obtain your data of interest, then feel free to contact NCDC through their customer support including helpful phone numbers, fax numbers, and email addresses. They are here to help and serve!
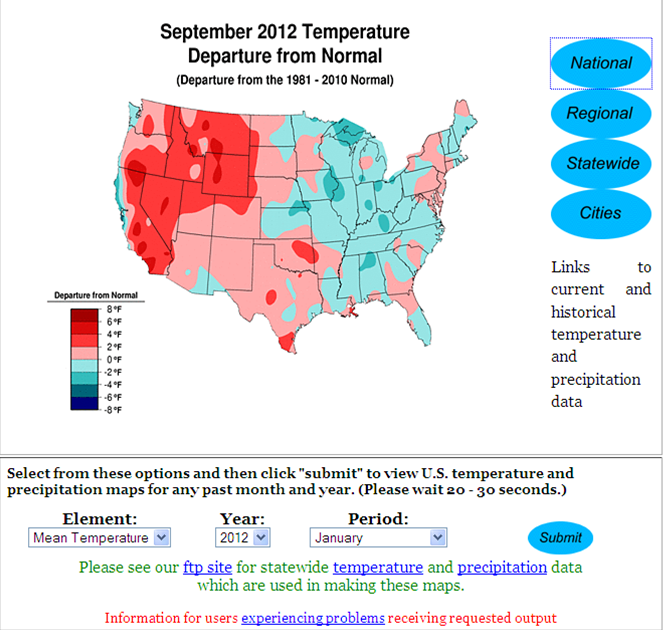
The Climate Prediction Center (CPC) also has many types of available data. Take a look at their Monitoring and Data Index page.


 Follow us on YouTube