Kansas City Daily Climate Extremes and Normals*
October 1888-Present*
* Normals are computed from 1991-2020 time frame.
* Last updated 5/13/2022
| Date | Max Temp | Year | Normal Max | Min Temp | Year | Normal Min | Max Precip | Year | Max Snow | Year | Normal Precip |
|---|---|---|---|---|---|---|---|---|---|---|---|
| 1 | 94 | 2006 | 74 | 31 | 1985 | 52 | 3.46 | 1927 | 0.0 | 3.25 | |
| 2 | 95 | 2006 | 73 | 34 | 2004 | 51 | 2.09 | 2005 | 0.0 | Avg Snowfall | |
| 3 | 95 | 2006 | 73 | 31 | 1987 | 51 | 1.84 | 1942 | 0.0 | 0.3 | |
| 4 | 92 | 1938 | 72 | 35 | 1999 | 50 | 2.83 | 1998 | 0.0 | ||
| 5 | 97 | 1963 | 72 | 34 | 1988 | 50 | 2.90 | 1967 | 0.0 | ||
| 6 | 95 | 1963 | 72 | 31 | 1991 | 50 | 3.01 | 1941 | T | 1891 | |
| 7 | 98 | 1939 | 71 | 26 | 2012 | 49 | 4.48 | 2018 | 0.0 | ||
| 8 | 91 | 1928 | 71 | 25 | 2000 | 49 | 2.05 | 1982 | 0.0 | ||
| 9 | 90 | 1963 | 70 | 27 | 2000 | 48 | 3.29 | 1985 | 0.0 | ||
| 10 | 97 | 1963 | 70 | 29 | 1993 | 48 | 2.98 | 1973 | 0.0 | ||
| 11 | 89 | 1962 | 69 | 27 | 1987 | 48 | 1.94 | 1973 | 0.0 | ||
| 12 | 91 | 1899 | 69 | 28 | 1909 | 47 | 1.98 | 1969 | 0.0 | ||
| 13 | 91 | 1899 | 69 | 27 | 1979 | 47 | 2.35 | 1981 | 0.0 | ||
| 14 | 92 | 1963 | 68 | 29 | 1937 | 46 | 1.58 | 1960 | 0.2 | 2018 | |
| 15 | 91 | 1938 | 68 | 30 | 2018 | 46 | 1.55 | 1967 | T | 2018 | |
| 16 | 90 | 1938 | 67 | 26 | 2018 | 46 | 1.46 | 1913 | T | 2002 | |
| 17 | 88 | 1950 | 67 | 25 | 1976 | 45 | 2.04 | 2007 | 3.3 | 1898 | |
| 18 | 87 | 1950 | 66 | 28 | 1972 | 45 | 1.15 | 1979 | 1.0 | 1898 | |
| 19 | 87 | 1963 | 66 | 21 | 1972 | 44 | 1.21 | 1983 | T | 1930 | |
| 20 | 89 | 1894 | 66 | 25 | 1989 | 44 | 2.40 | 1971 | T | 1930 | |
| 21 | 89 | 1978 | 65 | 24 | 1987 | 44 | 4.54 | 1908 | T | 1930 | |
| 22 | 87 | 1963 | 65 | 28 | 1982 | 43 | 2.82 | 1977 | 6.5 | 1996 | |
| 23 | 91 | 1939 | 64 | 24 | 1937 | 43 | 1.67 | 1977 | 0.0 | ||
| 24 | 87 | 1939 | 64 | 26 | 1999 | 43 | 3.26 | 1916 | 3.0 | 1908 | |
| 25 | 88 | 1939 | 63 | 28 | 1994 | 42 | 1.12 | 1898 | 1.5 | 1898 | |
| 26 | 87 | 1963 | 63 | 25 | 1980 | 42 | 2.71 | 1918 | 1.0 | 1997 | |
| 27 | 86 | 1950 | 62 | 22 | 1925 | 41 | 1.22 | 1980 | 0.5 | 1925 | |
| 28 | 84 | 1944 | 62 | 18 | 1925 | 41 | 1.44 | 1929 | 2.0 | 1913 | |
| 29 | 88 | 1937 | 62 | 22 | 1925 | 41 | 1.58 | 1896 | 0.8 | 1917 | |
| 30 | 91 | 1950 | 61 | 17 | 1925 | 40 | 3.48 | 1974 | 0.9 | 2019 | |
| 31 | 87 | 1950 | 61 | 17 | 1993 | 40 | 1.54 | 1900 | 1.0 | 1912 |


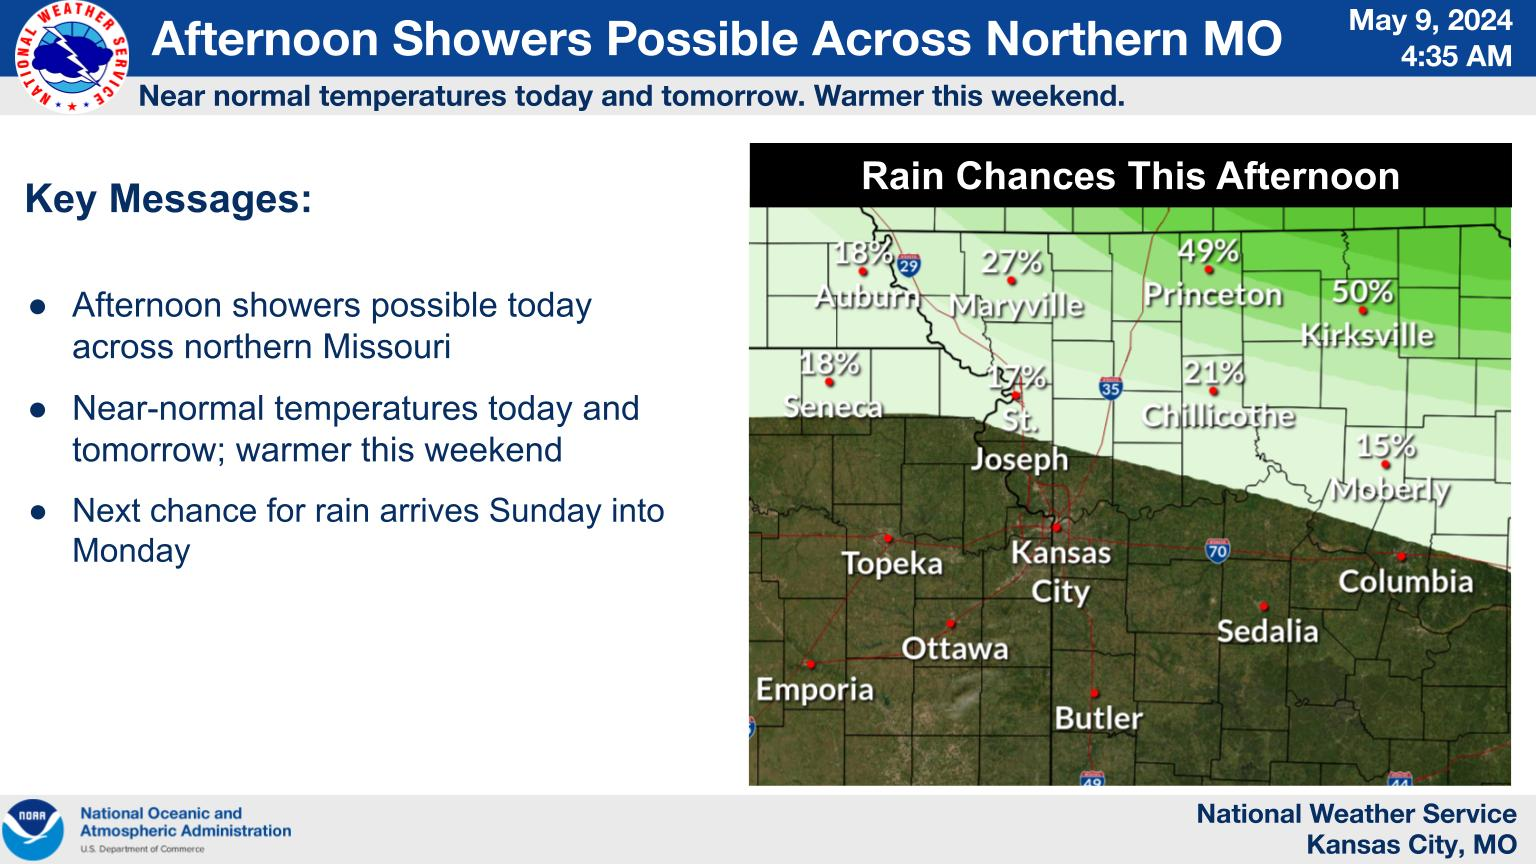 Weather Story
 Weather Map
 Local Radar
 Follow us on YouTube