Kansas City Daily Climate Extremes and Normals*
July 1888-Present*
* Normals are computed from 1991-2020 time frame.
* Last updated 5/13/22
| Date | Max Temp | Year | Normal Max | Min Temp | Year | Normal Min | Max Precip | Year | Normal Precip |
|---|---|---|---|---|---|---|---|---|---|
| 1 | 103 | 1933 | 87 | 54 | 1995 | 67 | 3.62 | 1902 | 4.58 |
| 2 | 105 | 1934 | 87 | 53 | 1924 | 67 | 4.33 | 2016 | |
| 3 | 103 | 1954 | 87 | 53 | 2014 | 67 | 1.75 | 1912 | |
| 4 | 108 | 1936 | 87 | 54 | 1997 | 68 | 3.63 | 1984 | |
| 5 | 104 | 1934 | 88 | 51 | 1997 | 68 | 2.76 | 1961 | |
| 6 | 104 | 2012 | 88 | 54 | 1967 | 68 | 5.08 | 1986 | |
| 7 | 105 | 2012 | 88 | 55 | 2004 | 68 | 2.95 | 1969 | |
| 8 | 101 | 1980 | 88 | 54 | 1891 | 68 | 4.59 | 1926 | |
| 9 | 104 | 1980 | 88 | 54 | 1891 | 68 | 3.78 | 1992 | |
| 10 | 104 | 1936 | 88 | 55 | 1996 | 68 | 2.99 | 1922 | |
| 11 | 108 | 1954 | 88 | 54 | 1895 | 68 | 2.19 | 2010 | |
| 12 | 109 | 1954 | 88 | 56 | 1990 | 68 | 2.98 | 2001 | |
| 13 | 112 | 1954 | 88 | 54 | 1975 | 68 | 1.78 | 1952 | |
| 14 | 111 | 1954 | 88 | 54 | 1990 | 68 | 1.23 | 1910 | |
| 15 | 109 | 1934 | 88 | 54 | 2014 | 68 | 4.16 | 1989 | |
| 16 | 107 | 1934 | 89 | 55 | 2014 | 68 | 1.35 | 1968 | |
| 17 | 108 | 1954 | 89 | 55 | 2009 | 68 | 2.40 | 1938 | |
| 18 | 111 | 1954 | 89 | 56 | 2009 | 68 | 4.00 | 1896 | |
| 19 | 109 | 1934 | 89 | 54 | 2009 | 68 | 2.72 | 1965 | |
| 20 | 109 | 1934 | 89 | 60 | 2014 | 68 | 3.23 | 1985 | |
| 21 | 107 | 1974 | 89 | 56 | 1988 | 68 | 1.67 | 1990 | |
| 22 | 106 | 1901 | 89 | 57 | 1988 | 68 | 1.53 | 1898 | |
| 23 | 106 | 1934 | 89 | 57 | 2019 | 68 | 1.90 | 1973 | |
| 24 | 110 | 1934 | 89 | 57 | 2004 | 68 | 2.35 | 1900 | |
| 25 | 108 | 1936 | 89 | 56 | 1911 | 68 | 3.56 | 1920 | |
| 26 | 106 | 1936 | 89 | 55 | 1962 | 68 | 2.94 | 2017 | |
| 27 | 108 | 1936 | 89 | 55 | 2013 | 68 | 2.20 | 1981 | |
| 28 | 103 | 1983 | 89 | 52 | 1994 | 68 | 4.57 | 1895 | |
| 29 | 105 | 2012 | 89 | 55 | 1994 | 68 | 1.88 | 2020 | |
| 30 | 107 | 1947 | 89 | 52 | 1971 | 68 | 3.82 | 1958 | |
| 31 | 106 | 1970 | 89 | 54 | 1925 | 68 | 1.43 | 1981 |


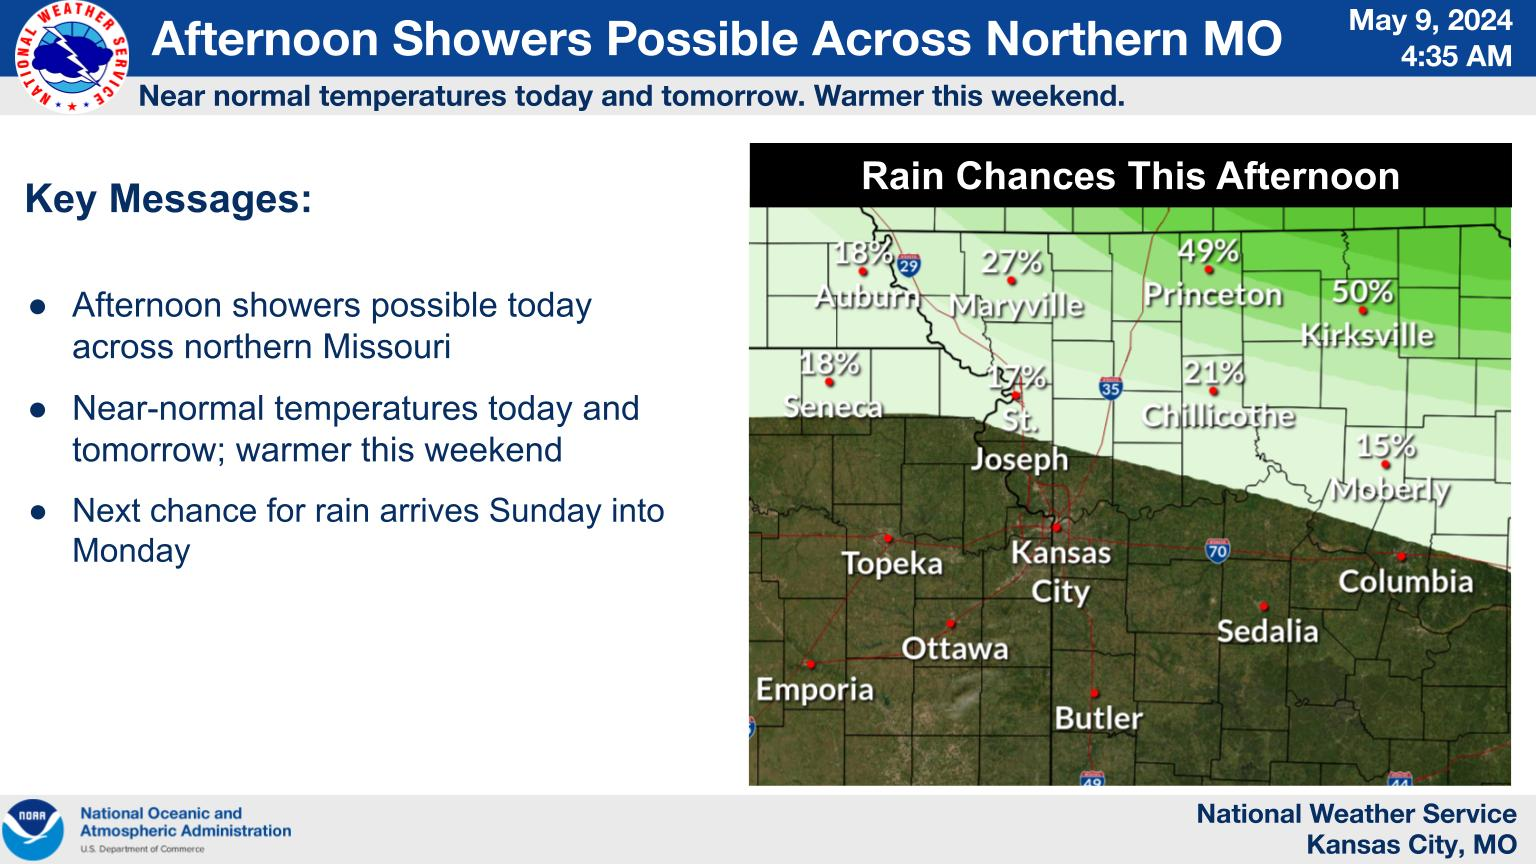 Weather Story
 Weather Map
 Local Radar
 Follow us on YouTube