Kansas City Daily Climate Extremes and Normals*
December 1888-Present
* Normals are computed from 1991-2020 time frame.
* Last updated 5/13/2022
| Date | Max Temp | Year | Normal Max | Min Temp | Year | Normal Min | Max Precip | Year | Max Snow | Year | Normal Precip |
|---|---|---|---|---|---|---|---|---|---|---|---|
| 1 | 70 | 1970 | 47 | 2 | 1893 | 28 | 0.94 | 2018 | 1.5 | 1985 | 1.57 |
| 2 | 71 | 2021 | 47 | 2 | 1985 | 28 | 0.68 | 1967 | 2.8 | 1893 | Avg Snowfall |
| 3 | 74 | 2012 | 46 | 6 | 1895 | 27 | 2.01 | 1947 | 7.2 | 1898 | 4.0 |
| 4 | 72 | 2017 | 46 | 6 | 1898 | 27 | 2.16 | 1944 | 4.3 | 1925 | |
| 5 | 74 | 2001 | 45 | 4 | 1950 | 27 | 1.65 | 1913 | 8.5 | 1942 | |
| 6 | 74 | 1939 | 45 | -3 | 1950 | 26 | 2.82 | 1980 | 3.9 | 1909 | |
| 7 | 70 | 1894 | 45 | 0 | 2013 | 26 | 2.08 | 1980 | 7.3 | 2005 | |
| 8 | 69 | 1946 | 44 | -7 | 1917 | 26 | 0.66 | 1946 | 3.7 | 1961 | |
| 9 | 68 | 2020 | 44 | -5 | 2005 | 26 | 1.51 | 1911 | 7.5 | 1944 | |
| 10 | 69 | 1970 | 44 | -5 | 1919 | 25 | 0.85 | 1982 | 2.6 | 1955 | |
| 11 | 70 | 1965 | 43 | 0 | 2000 | 25 | 1.10 | 2007 | 5.3 | 1960 | |
| 12 | 70 | 1889 | 43 | -5 | 1989 | 25 | 0.67 | 2001 | 4.0 | 1914 | |
| 13 | 73 | 1948 | 43 | -6 | 1917 | 24 | 2.59 | 1992 | 7.0 | 2000 | |
| 14 | 67 | 1933 | 43 | -8 | 1901 | 24 | 1.66 | 1975 | 9.7 | 1987 | |
| 15 | 74 | 2021 | 42 | -16 | 1989 | 24 | 0.68 | 1940 | 3.3 | 2019 | |
| 16 | 67 | 2006 | 42 | -14 | 1989 | 24 | 0.55 | 1928 | 4.2 | 1981 | |
| 17 | 72 | 1939 | 42 | -6 | 1981 | 23 | 0.40 | 1929 | 6.3 | 1945 | |
| 18 | 64 | 1976 | 41 | -15 | 1983 | 23 | 1.69 | 1895 | 3.5 | 1989 | |
| 19 | 68 | 1889 | 41 | -18 | 1983 | 23 | 1.22 | 1933 | 2.2 | 1895 | |
| 20 | 67 | 1941 | 41 | -17 | 1983 | 23 | 1.10 | 2006 | 5.8 | 1895 | |
| 21 | 63 | 1893 | 41 | -18 | 1989 | 23 | 1.20 | 1949 | 6.0 | 1953 | |
| 22 | 67 | 1933 | 41 | -23 | 1989 | 22 | 0.97 | 1941 | 7.8 | 1961 | |
| 23 | 67 | 1933 | 40 | -23 | 1989 | 22 | 0.66 | 1918 | 7.4 | 1918 | |
| 24 | 72 | 2021 | 40 | -17 | 1983 | 22 | 1.65 | 1895 | 4.8 | 1918 | |
| 25 | 67 | 1922 | 40 | -16 | 1983 | 22 | 0.29 | 2016 | 3.3 | 2009 | |
| 26 | 66 | 2008 | 40 | -13 | 1892 | 22 | 1.14 | 1942 | 3.0 | 1939 | |
| 27 | 73 | 1946 | 40 | -6 | 1924 | 21 | 1.26 | 2008 | 5.7 | 1966 | |
| 28 | 69 | 1984 | 39 | -10 | 1924 | 21 | 1.50 | 2019 | 4.1 | 1943 | |
| 29 | 68 | 1947 | 39 | -9 | 1917 | 21 | 1.19 | 2020 | 1.5 | 1969 | |
| 30 | 68 | 2010 | 39 | -8 | 1983 | 21 | 1.10 | 1906 | 6.7 | 1927 | |
| 31 | 66 | 1951 | 39 | -11 | 1976 | 21 | 1.35 | 1931 | 7.7 | 1978 |


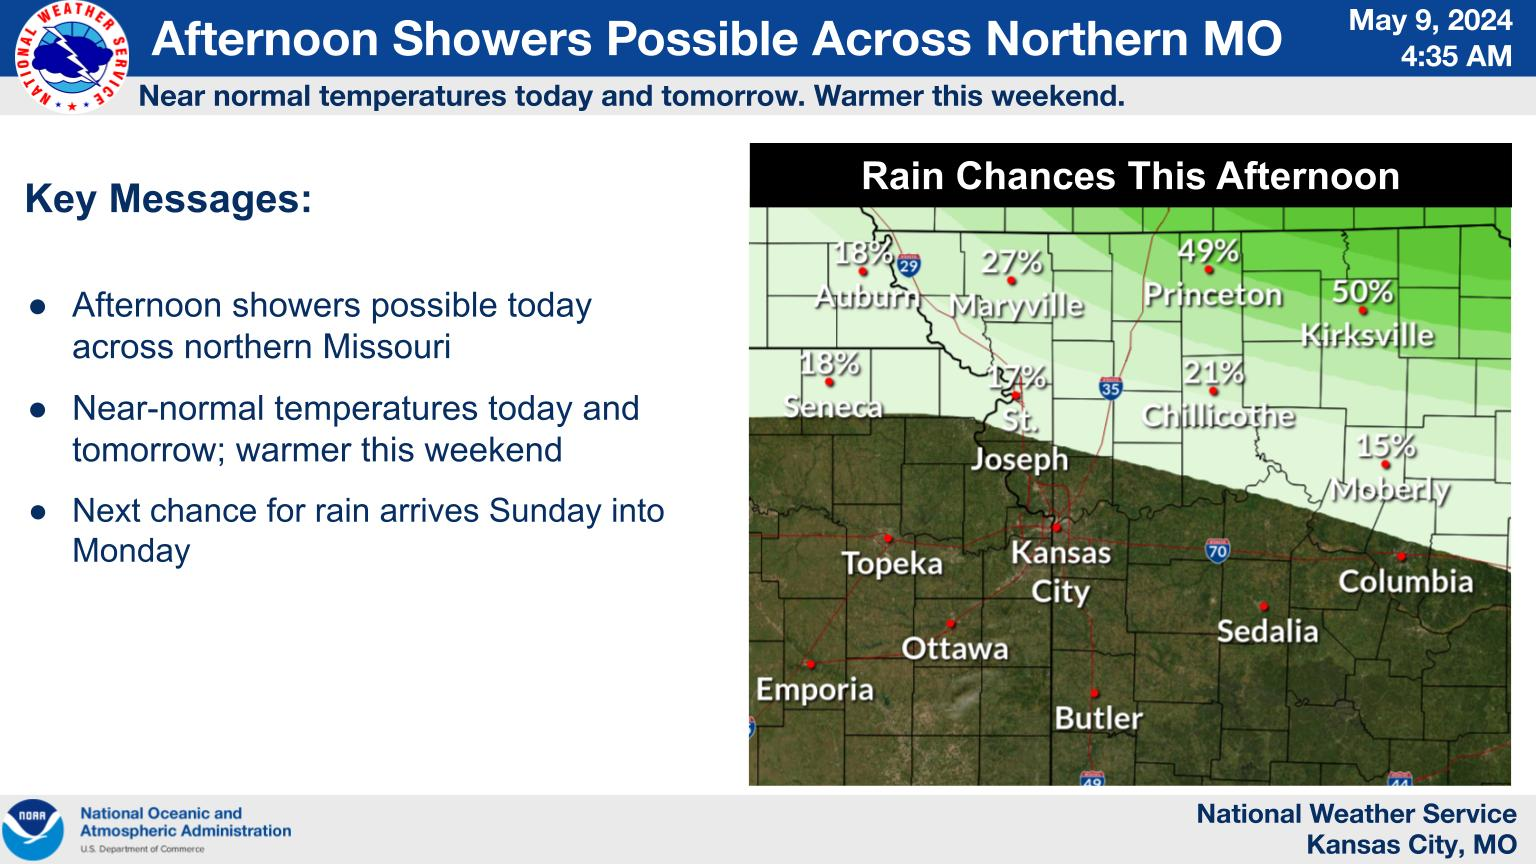 Weather Story
 Weather Map
 Local Radar
 Follow us on YouTube