
A stationary front will continue to bring heavy to excessive rainfall to South Florida into Saturday with localized and urban flooding possible. Heavy to excessive rainfall is forecast through Saturday over the southern Rockies into the northern Plains. Instances of flash flooding are possible, especially in higher terrain and burn scars. Read More >
|
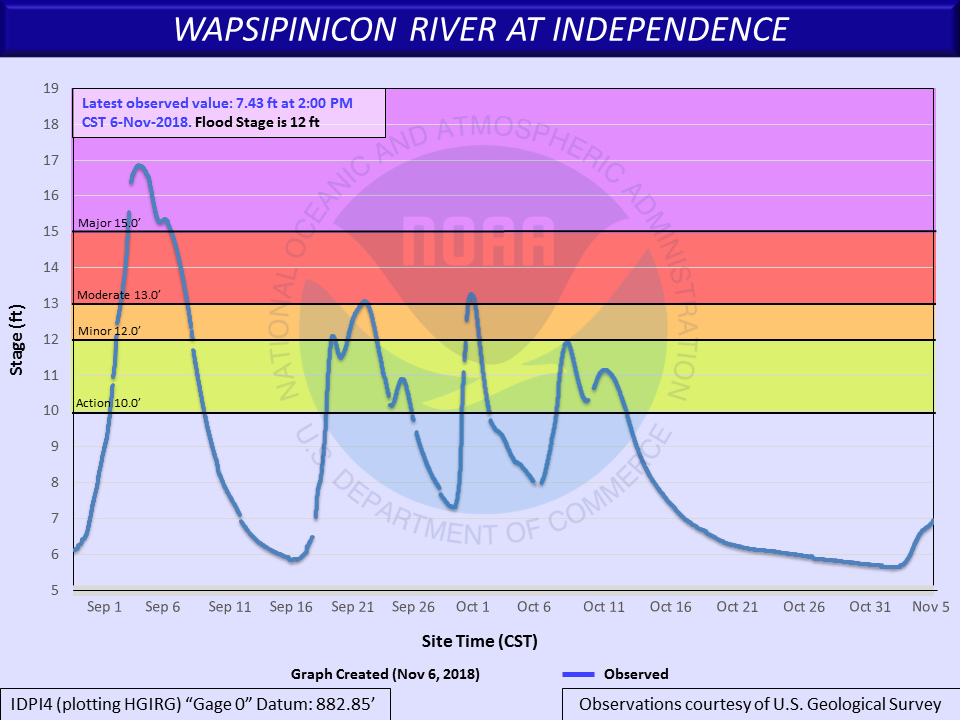
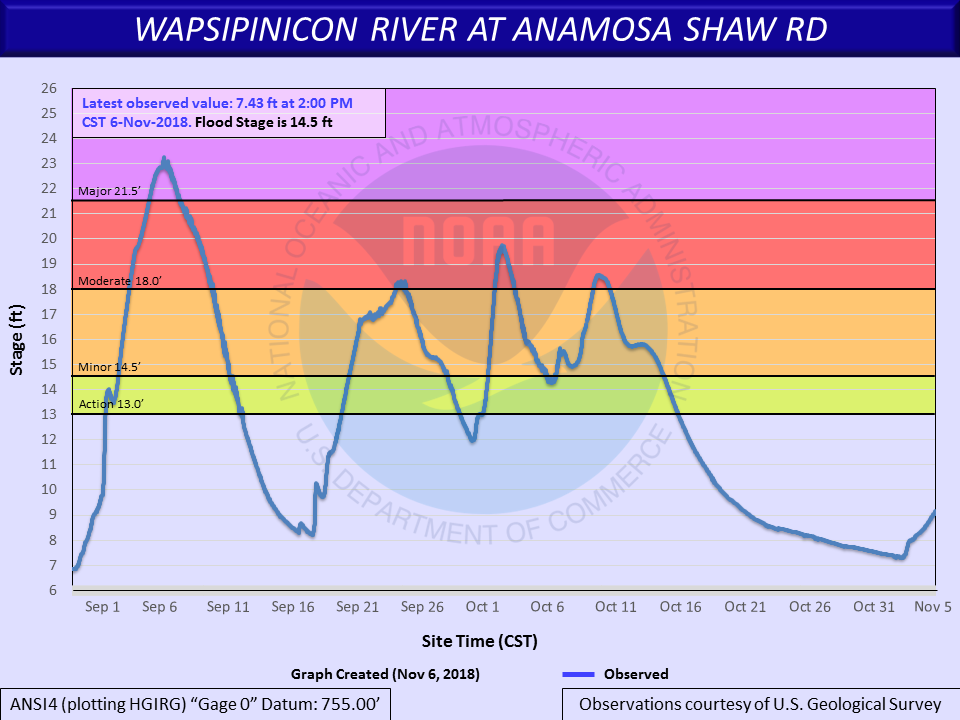
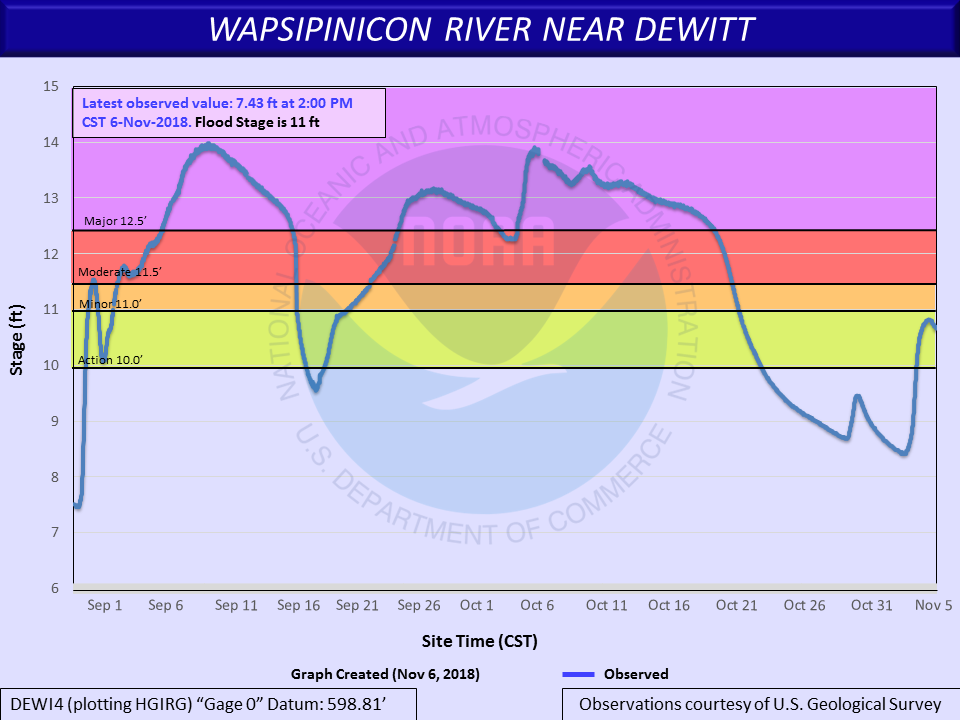
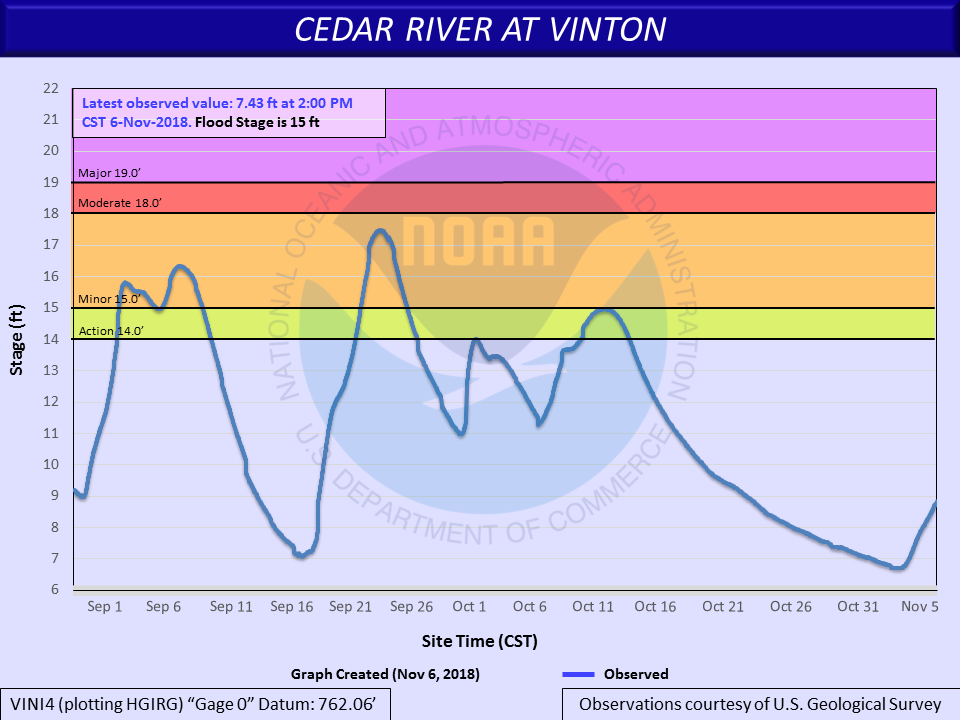
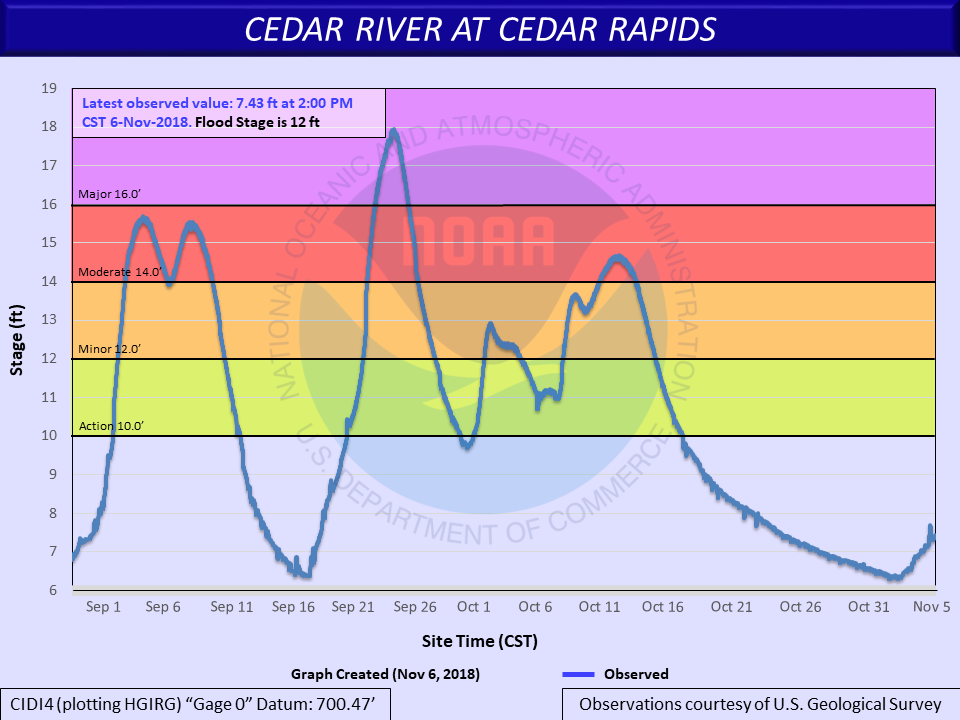
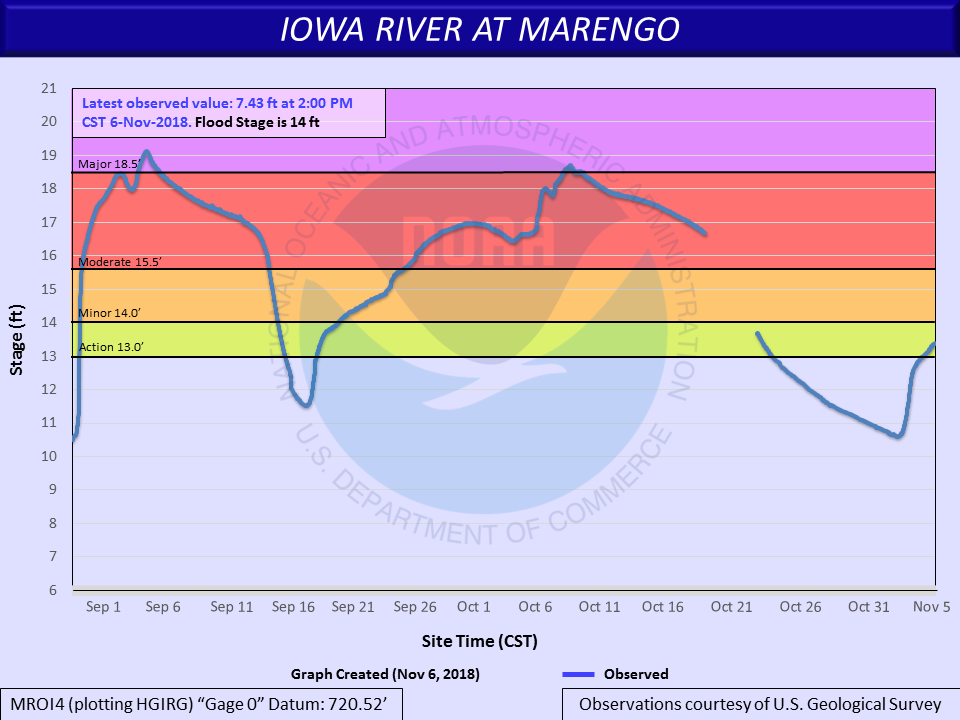
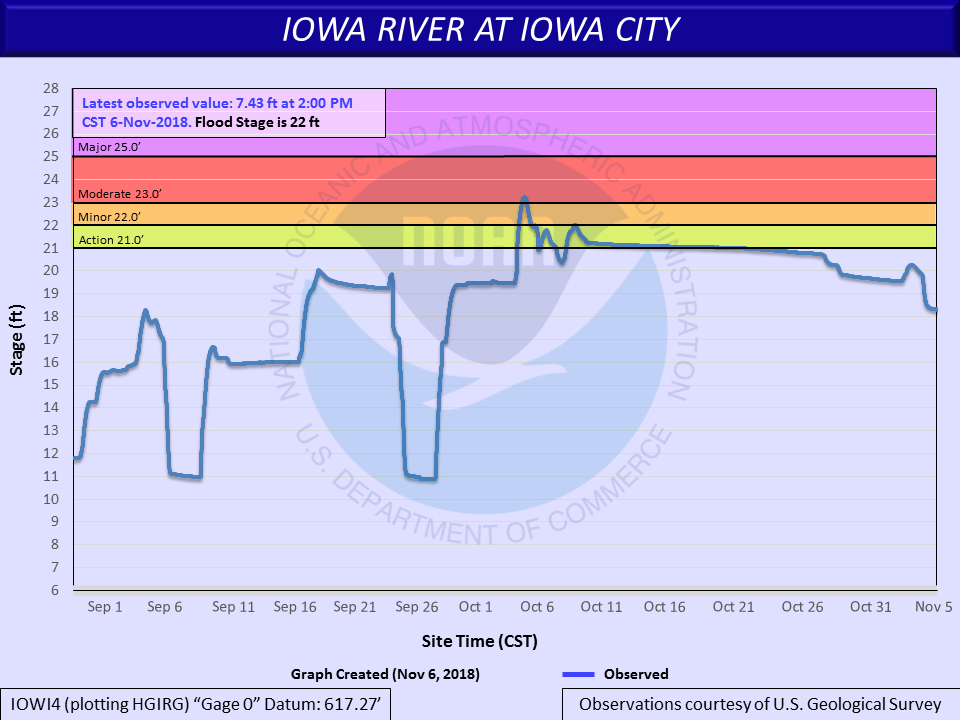
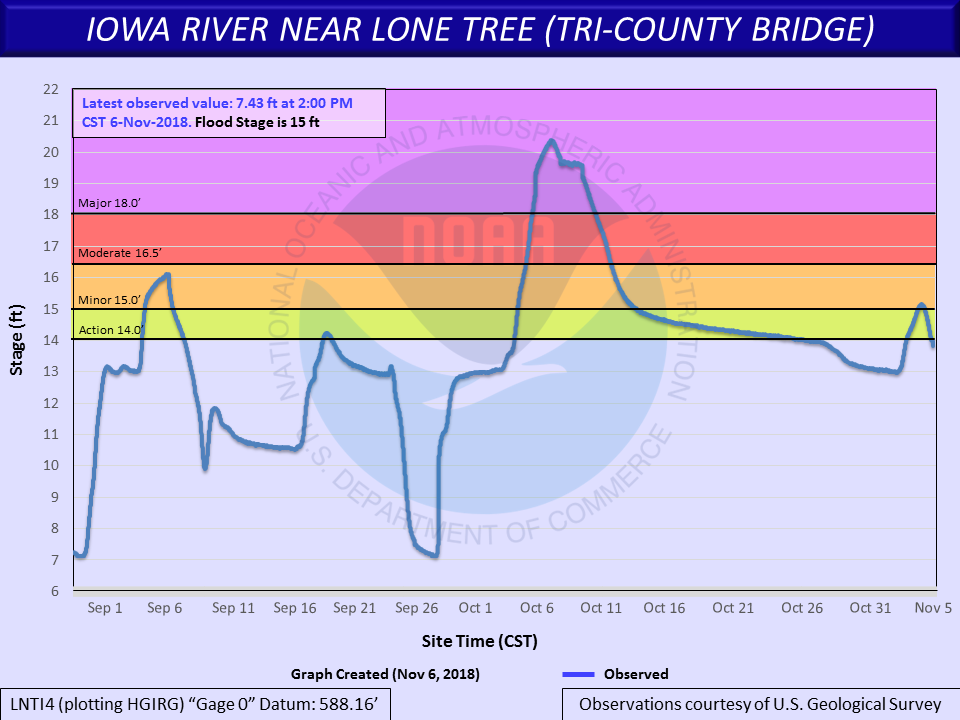
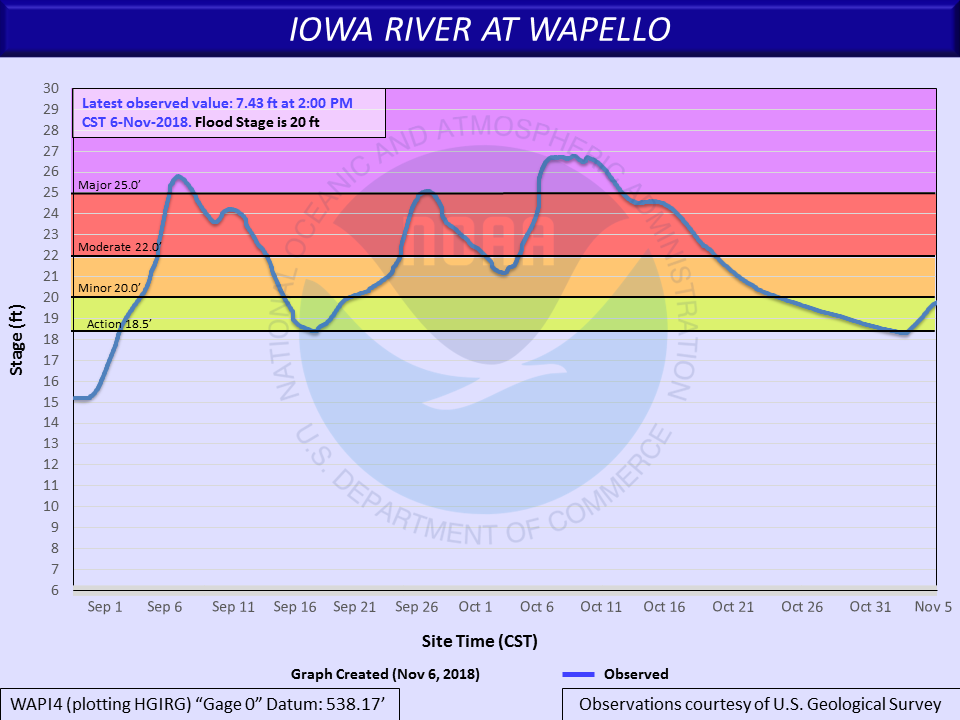
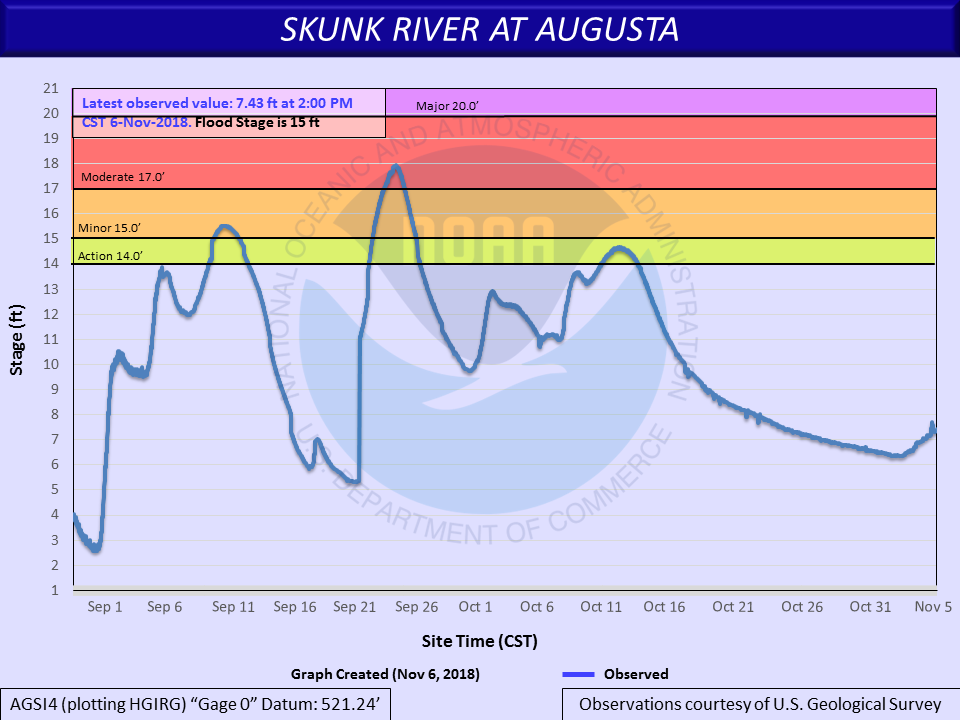
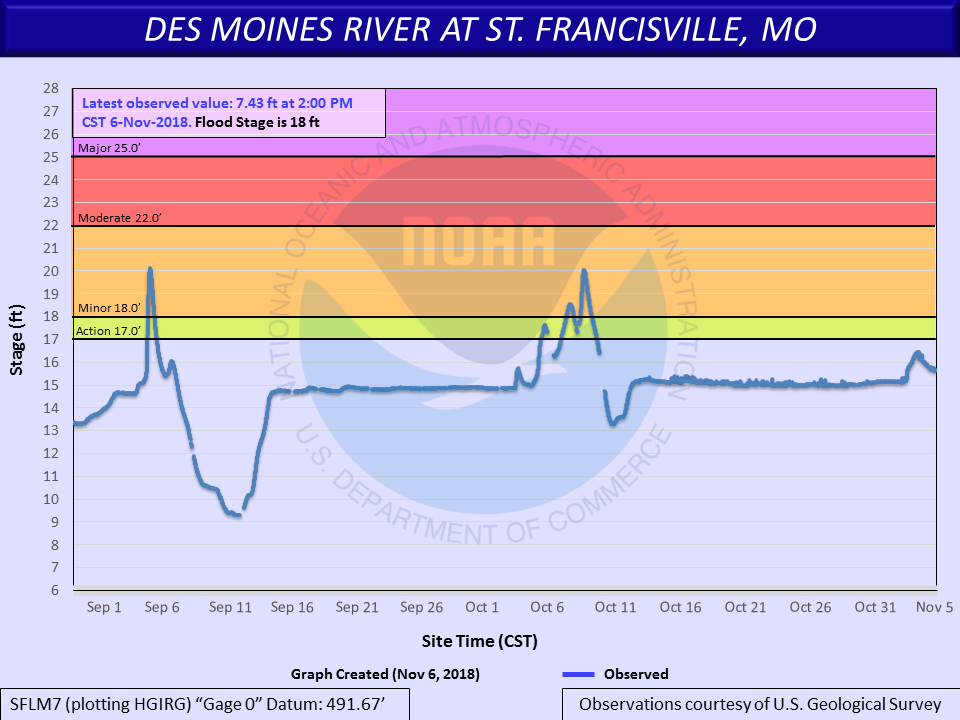
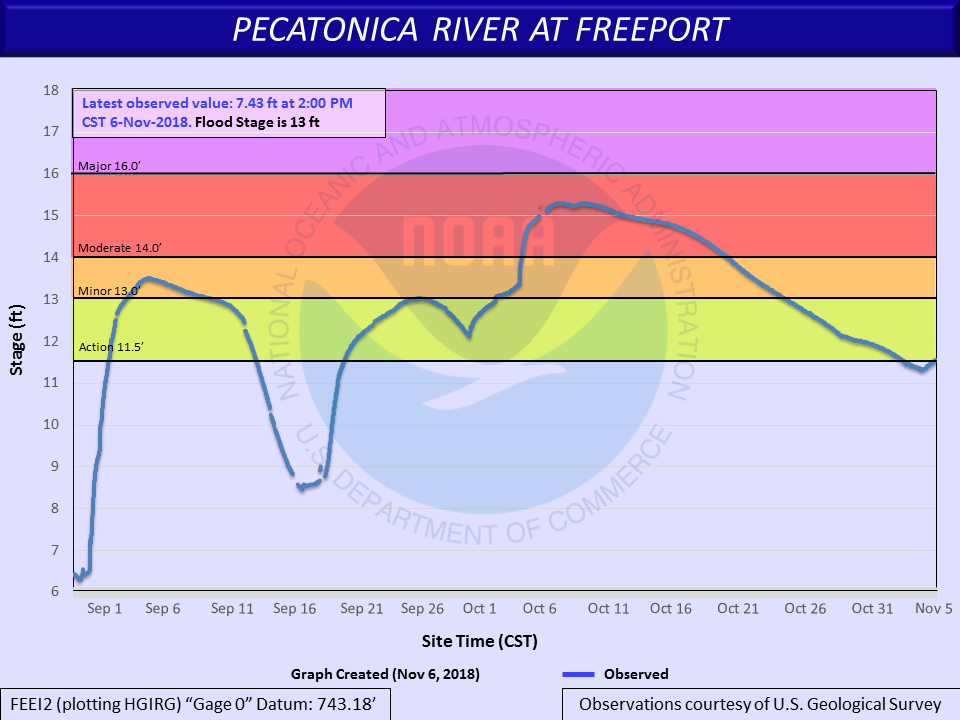
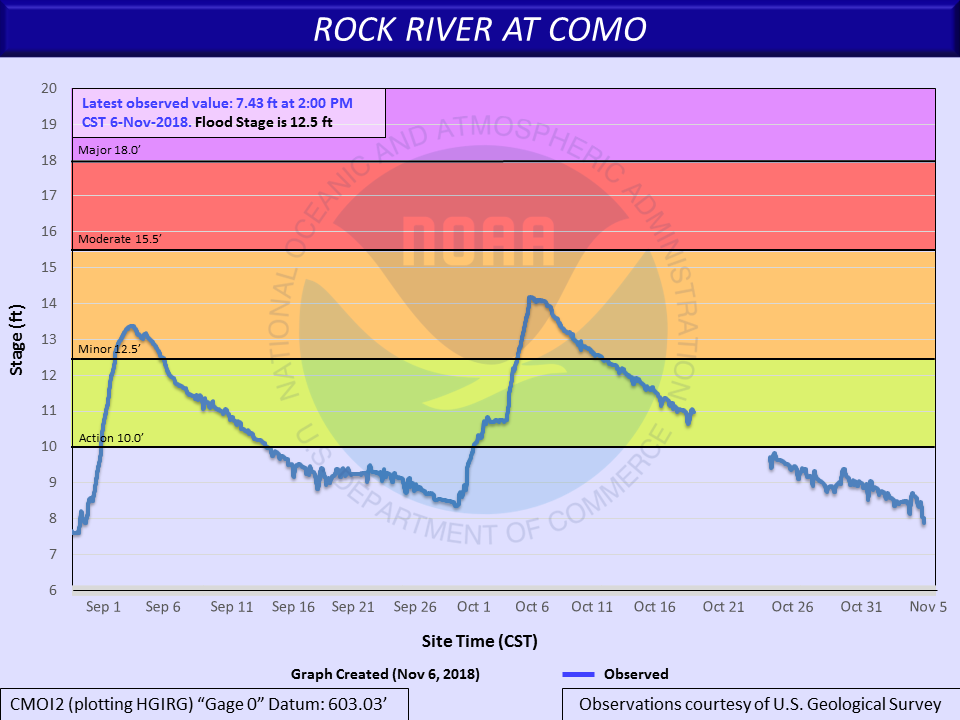
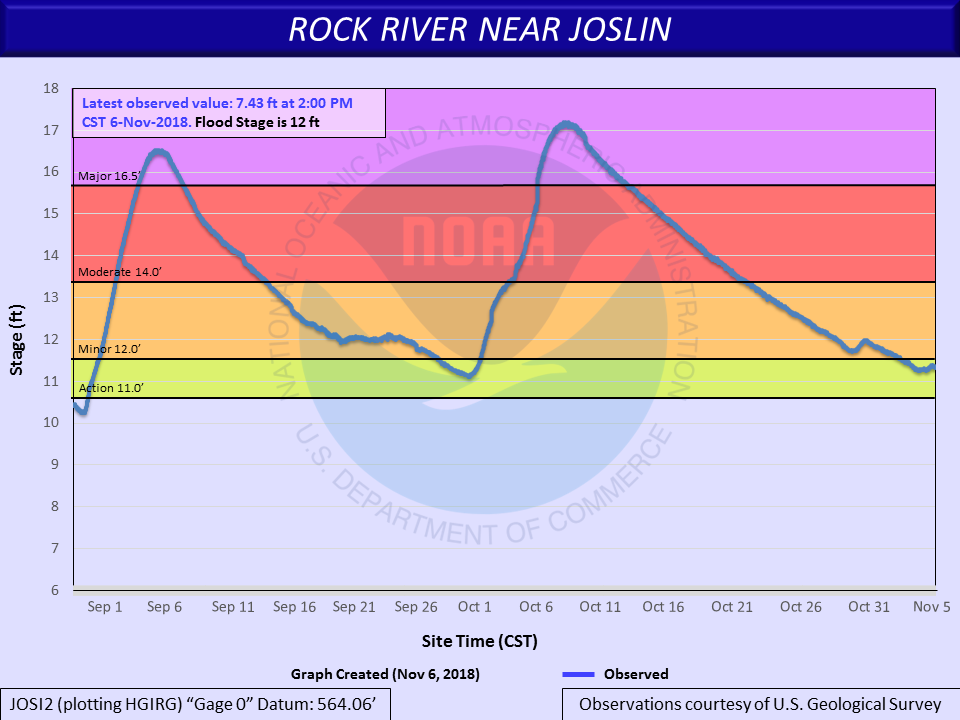
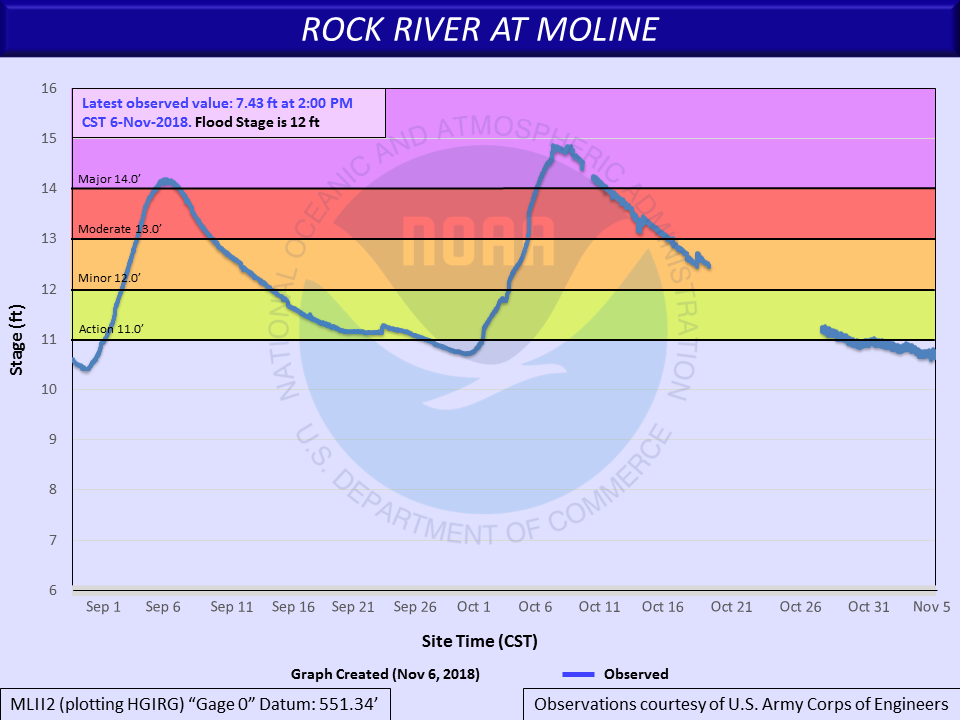
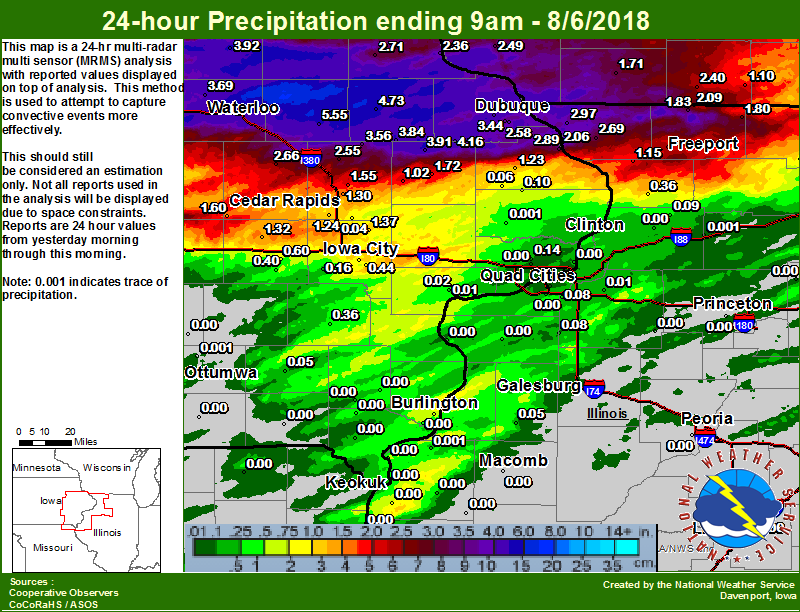
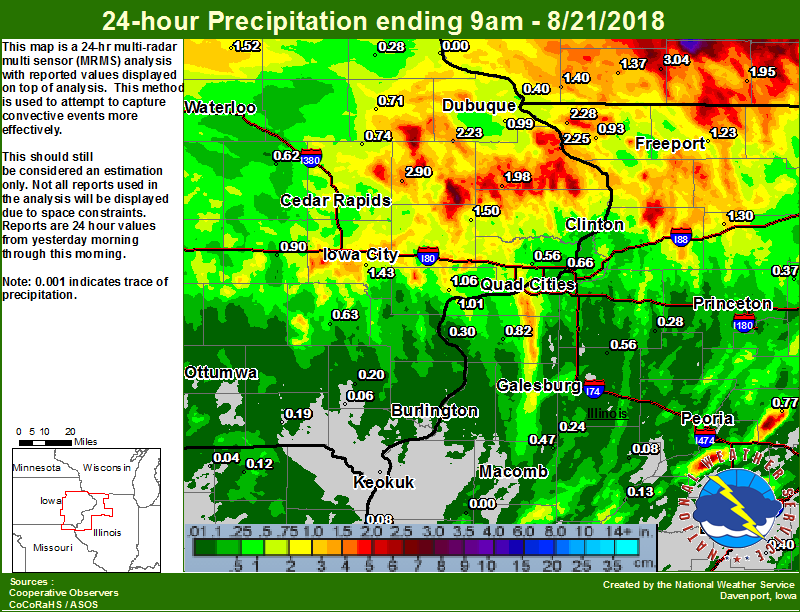
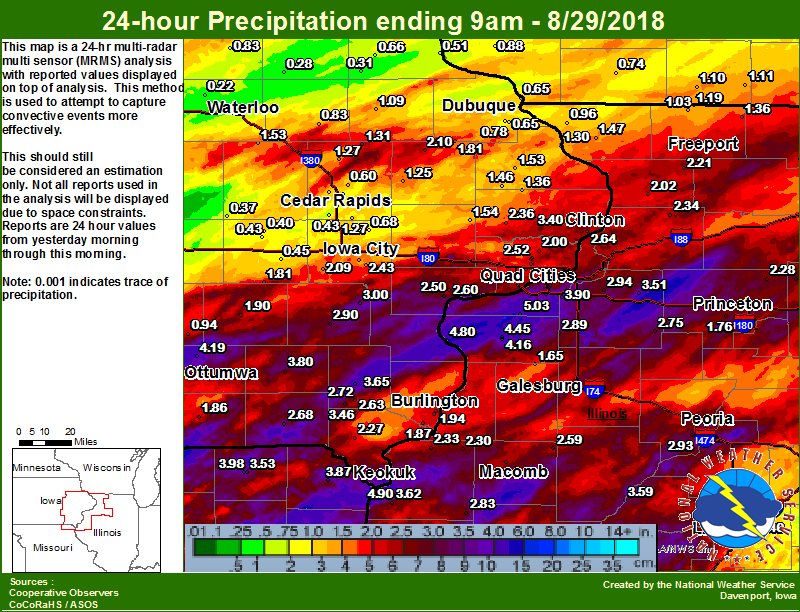
Widespread heavy rain fell from the end of August through early September, and also in October across the region. Rainfall totals over 20 inches fell in just 3 months across much of eastern IA and northwest IL. This water fell across already saturated soils, and eventually found its way into area rivers and tributaries. This led to significant rises of river levels, and eventually moderate to major flooding. The Wapsipinicon, Rock, English, Skunk, Iowa, Cedar, Pecatonica and Mississippi Rivers were all affected. |
 Iowa-Cedar Flood Survey 09/12/18 - Courtesy Iowa Flood Center |
Flooding
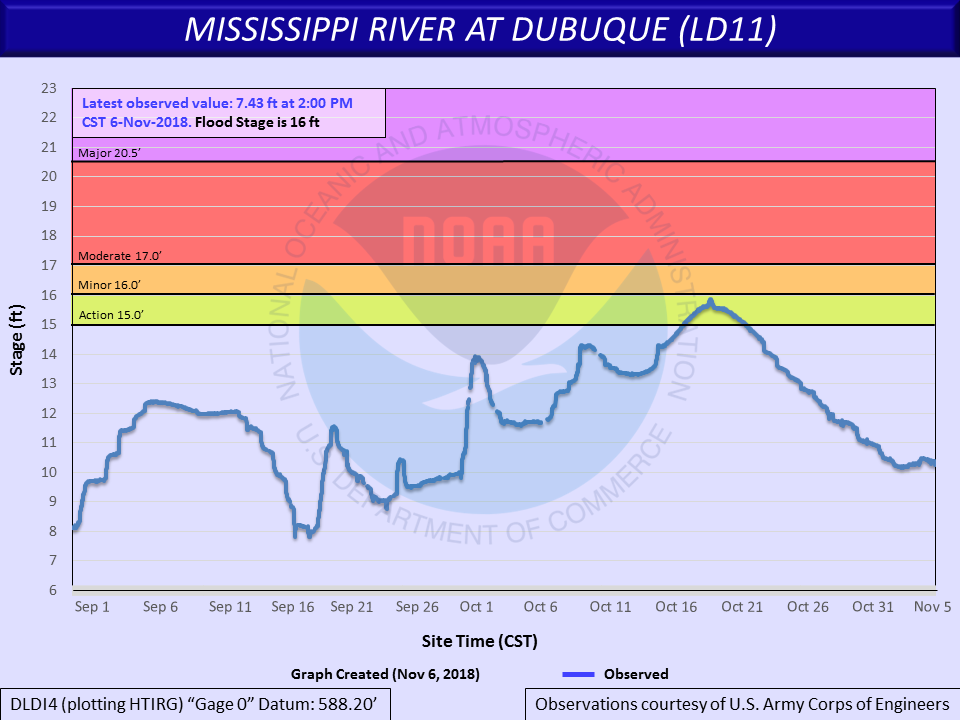
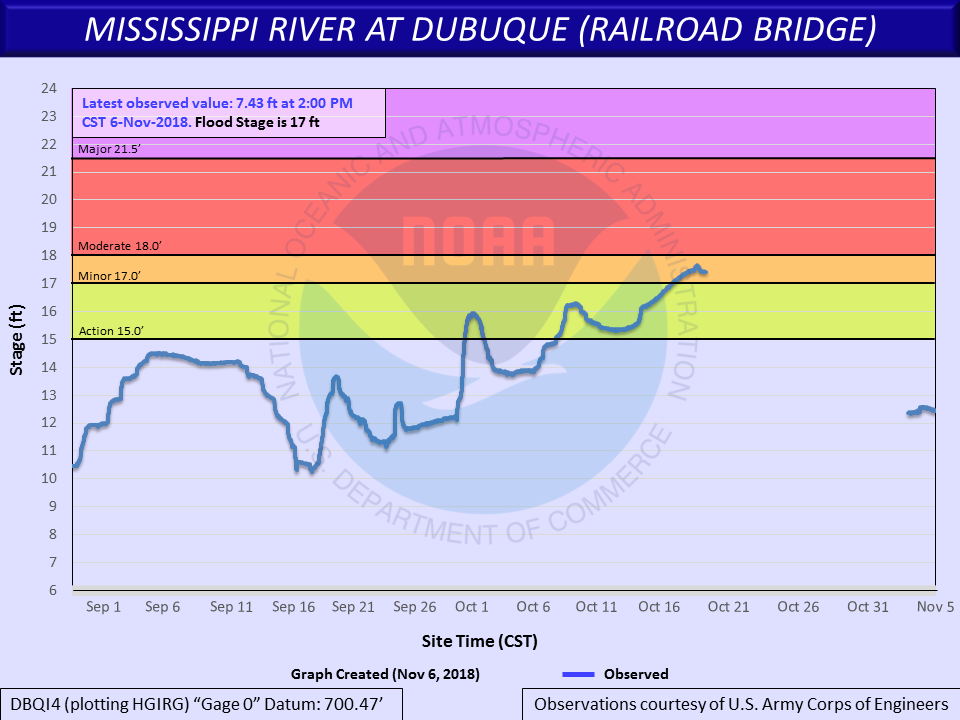
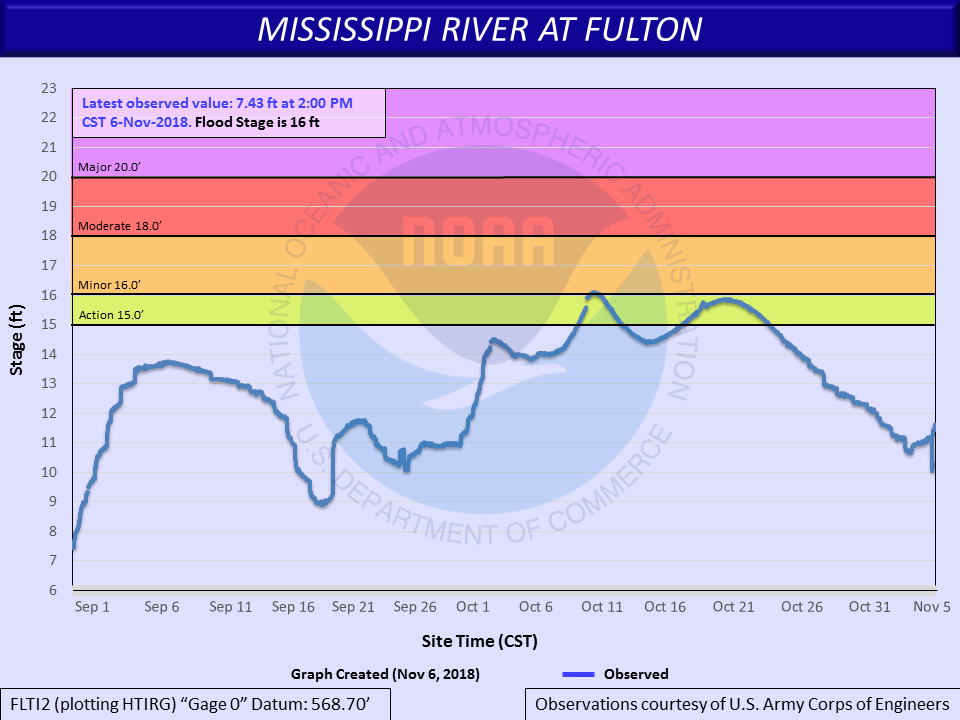
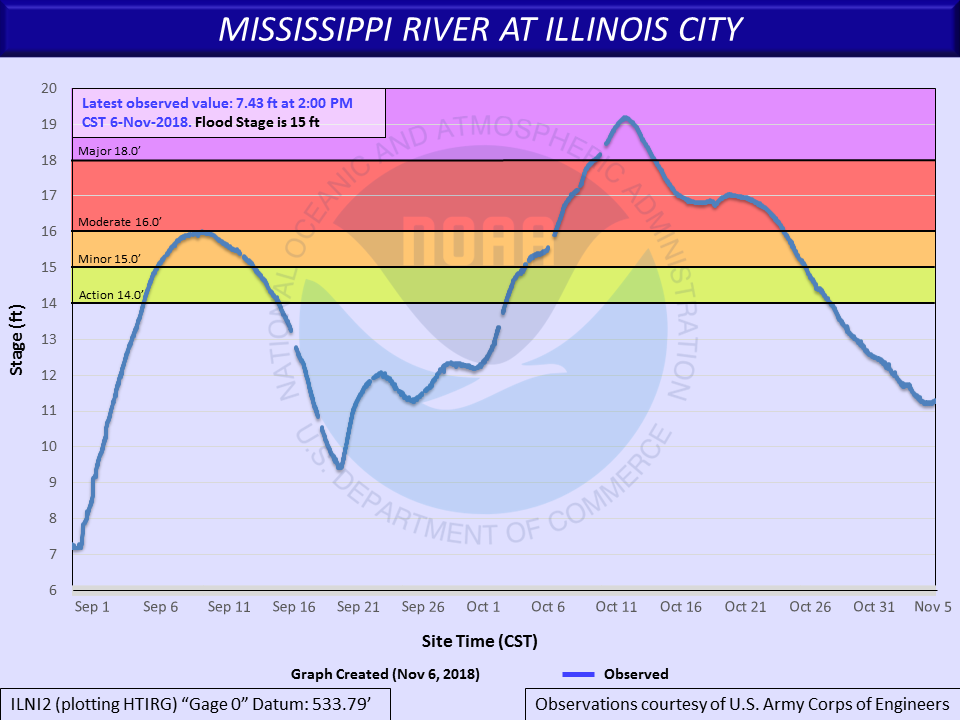
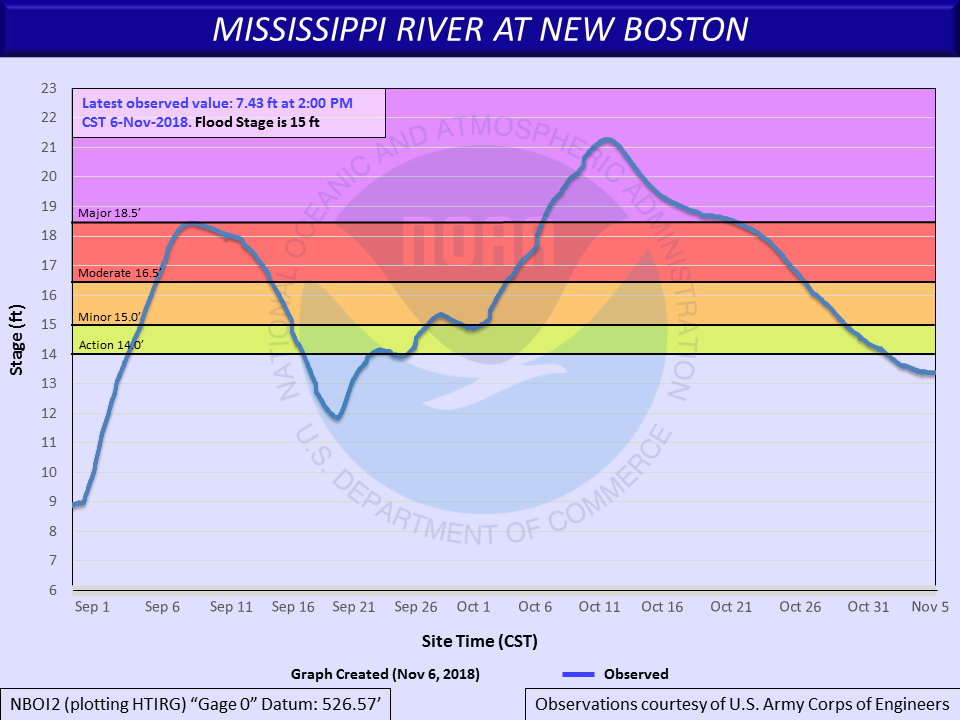
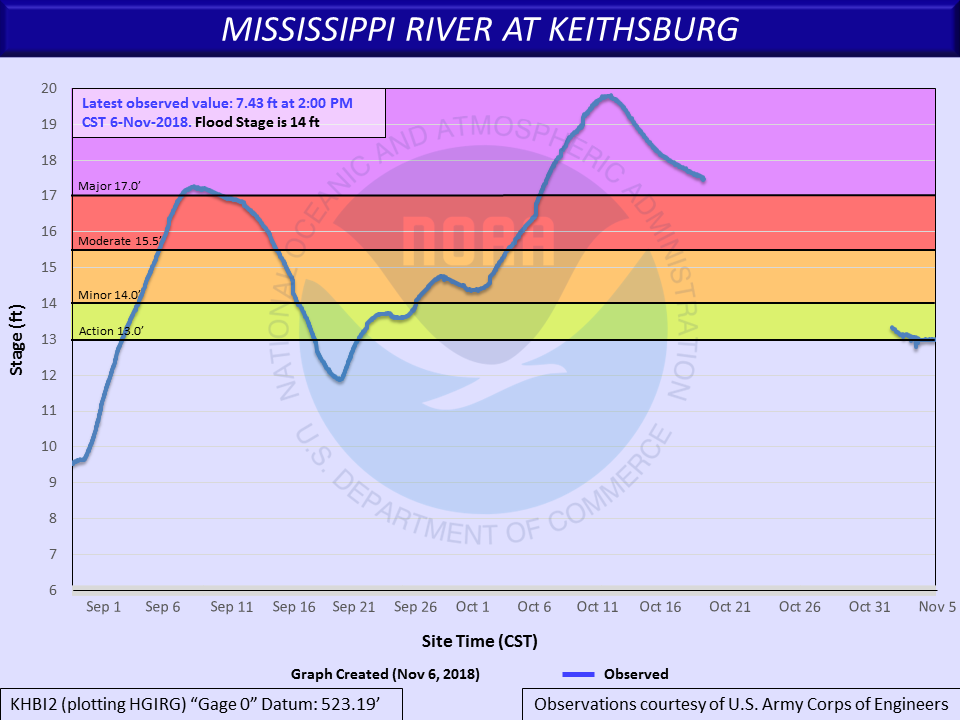
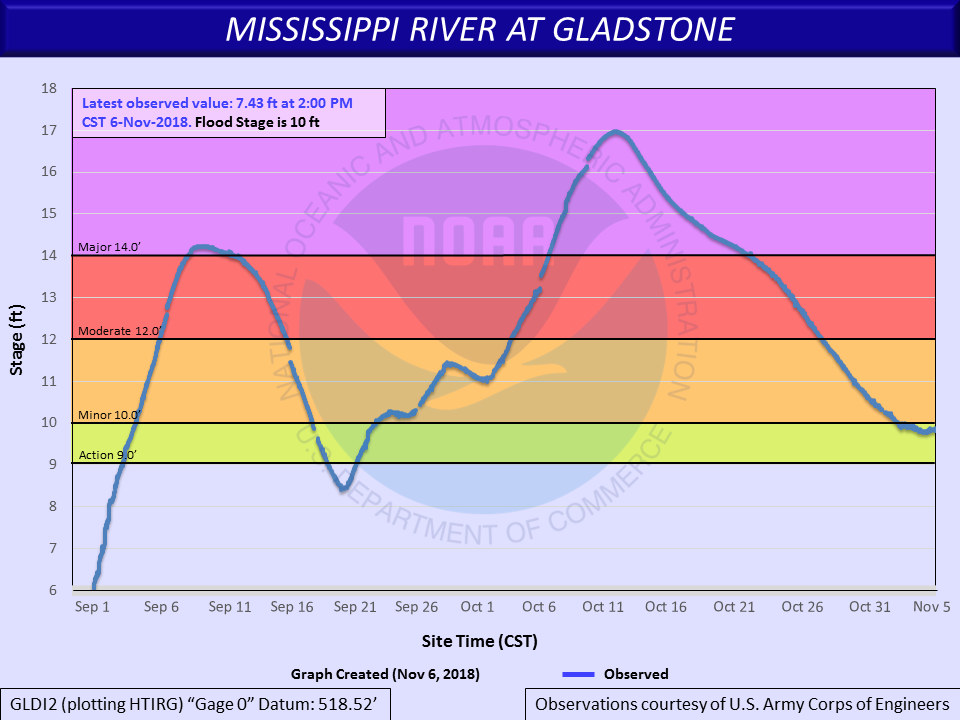
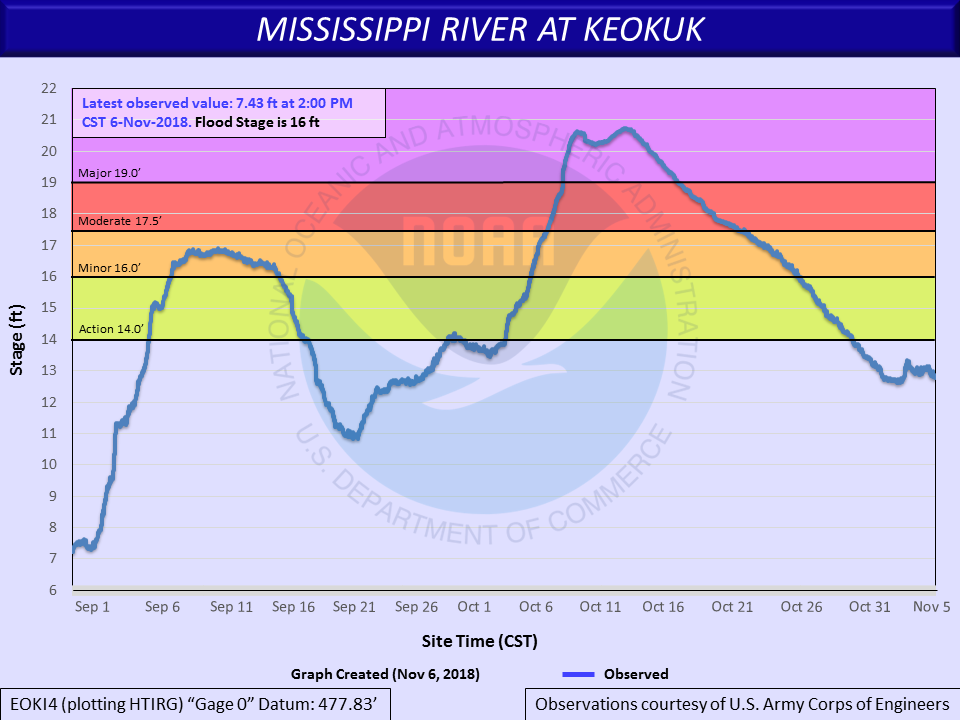
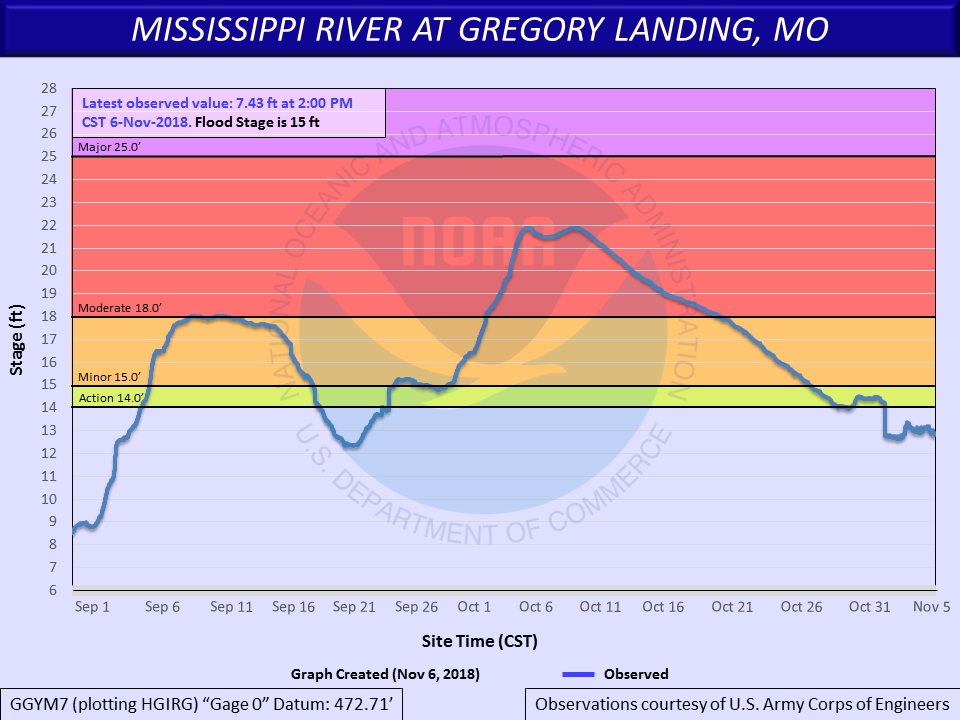
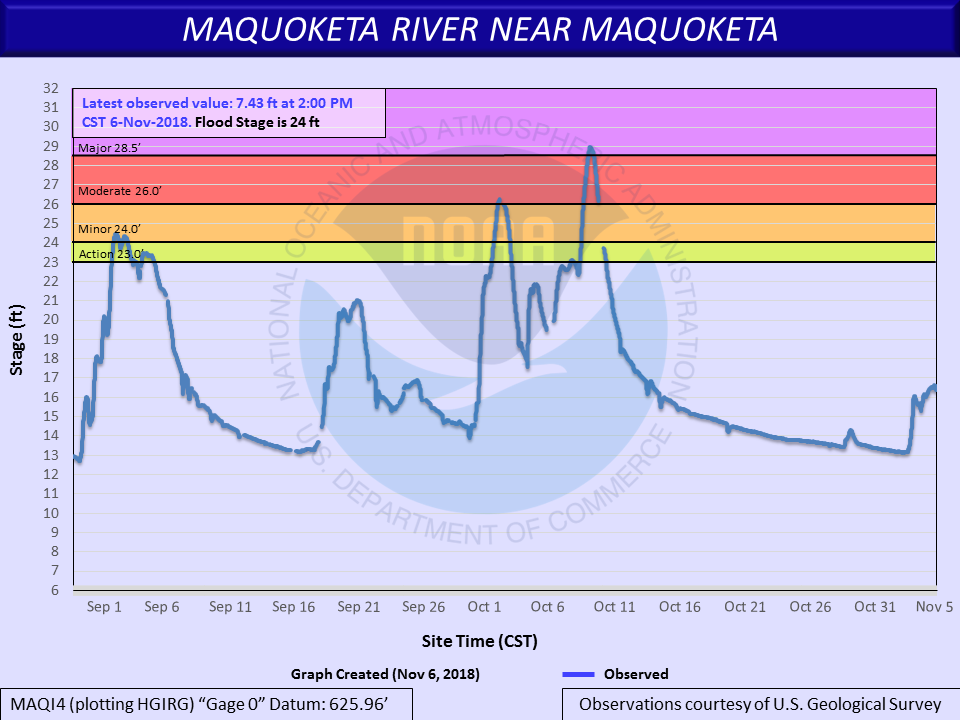
The following graphs are for the entire period from September through October for area rivers. These graphs show the long length of time to which a river was in flood during Fall 2018.
Jump to River: Maquoketa Wapsipinicon Cedar Iowa English Skunk Des Moines Pecatonica Rock
Mississippi River
 |
 |
 |
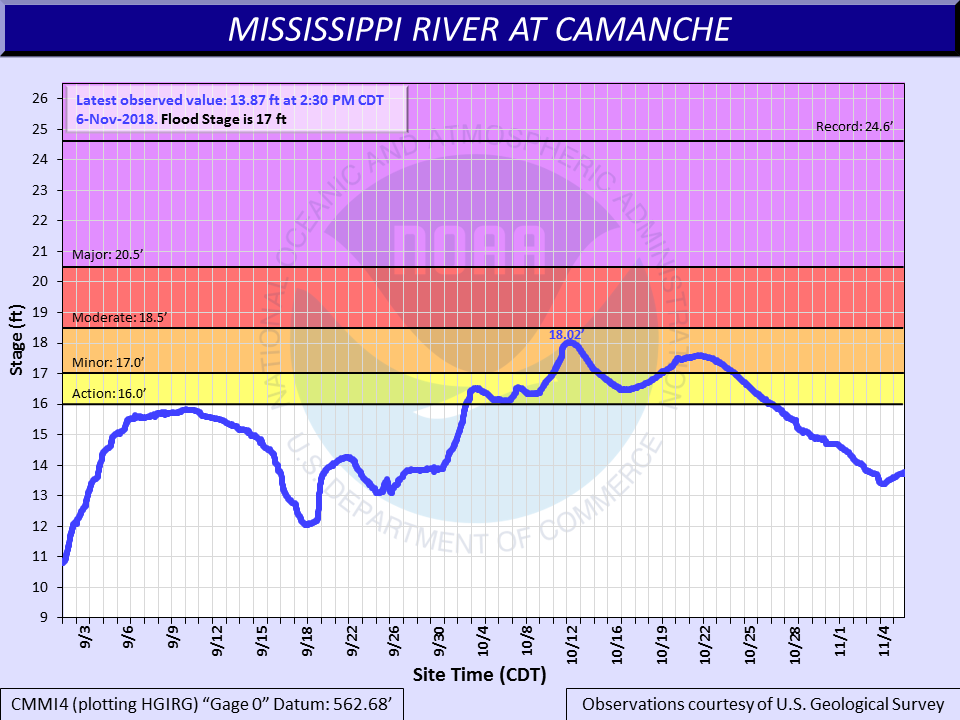 |
| Dubuque LD 11 | Dubuque Railroad Bridge | Fulton LD 13 | Camanche |
 |
 |
 |
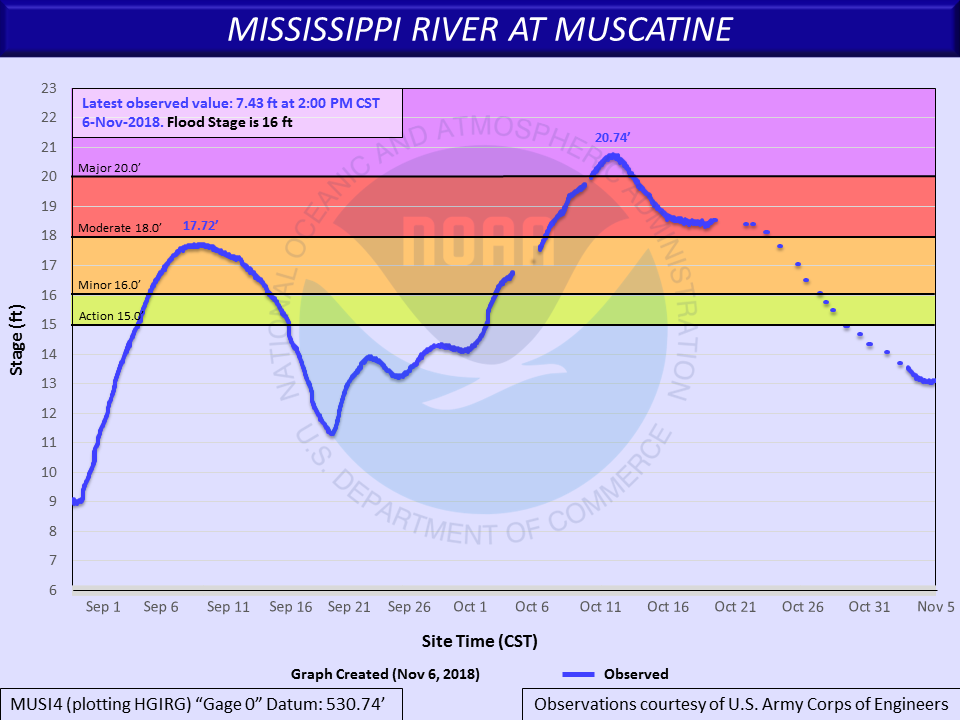 |
| Le Claire LD 14 | Rock Island LD 15 | Illinois City LD 16 | Muscatine |
 |
 |
 |
 |
| New Boston LD 17 | Keithsburg | Gladstone LD 18 | Burlington |
 |
 |
||
| Keokuk LD 19 | Gregory Landing |
 |
|||
| Maquoketa |
 |
 |
 |
|
| Independence | Anamosa | De Witt |
 |
 |
 |
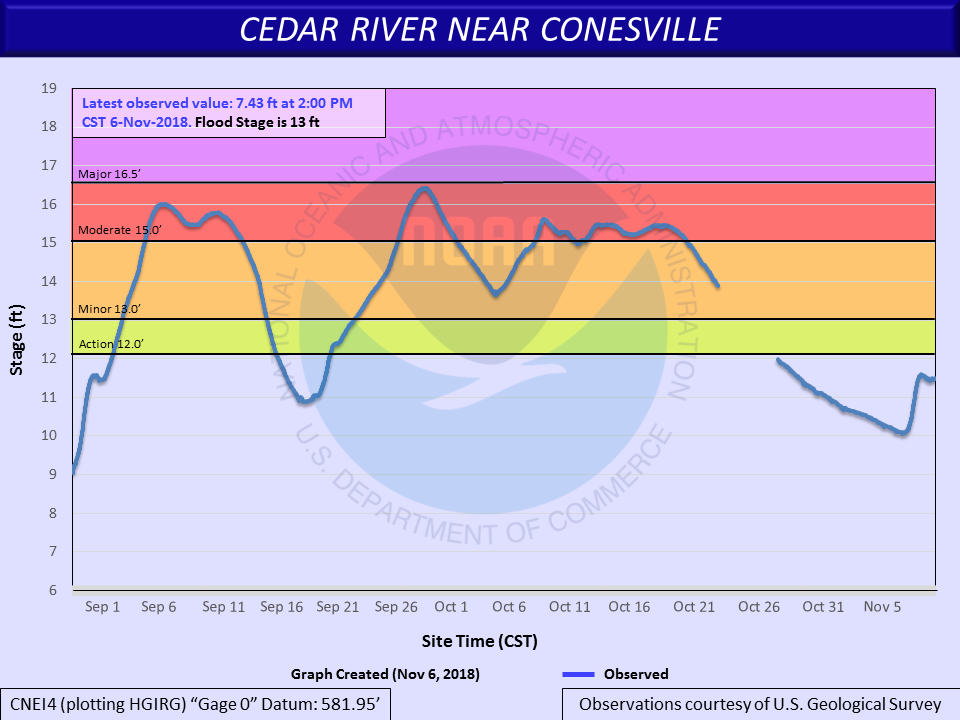 |
| Vinton | Cedar Rapids | Cedar Bluff | Conesville |
 |
 |
 |
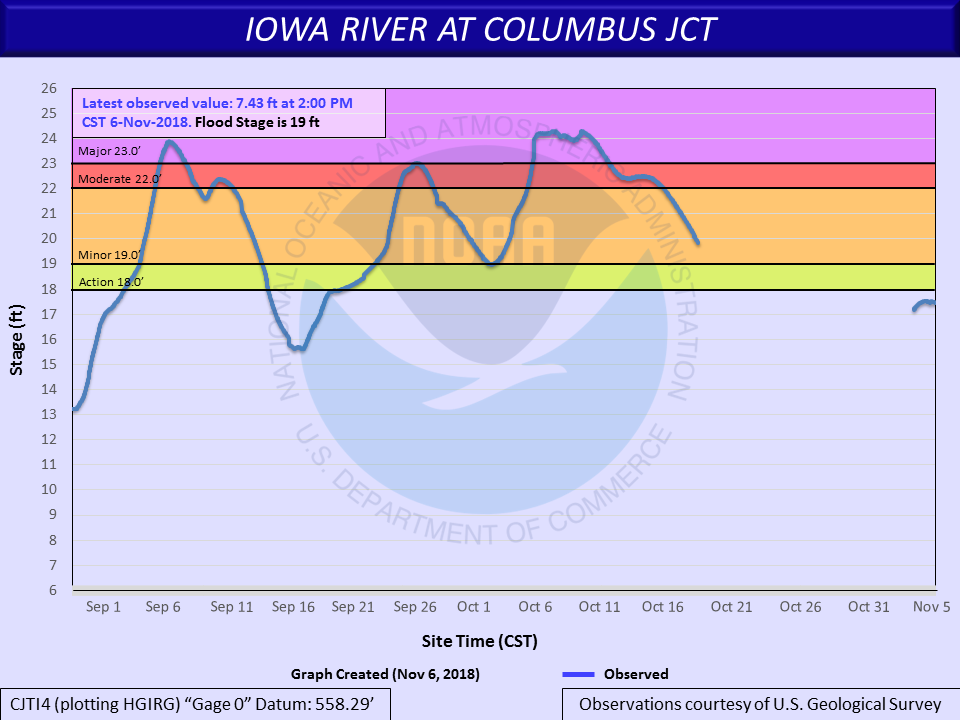 |
| Marengo | Iowa City | Lone Tree | Columbus Junction |
 |
 |
||
| Wapello | Oakville |
 |
|||
| Kalona |
 |
 |
||
| Sigourney | Augusta |
 |
|||
| St. Francisville |
 |
|||
| Freeport |
 |
 |
 |
|
| Como | Joslin | Moline | |
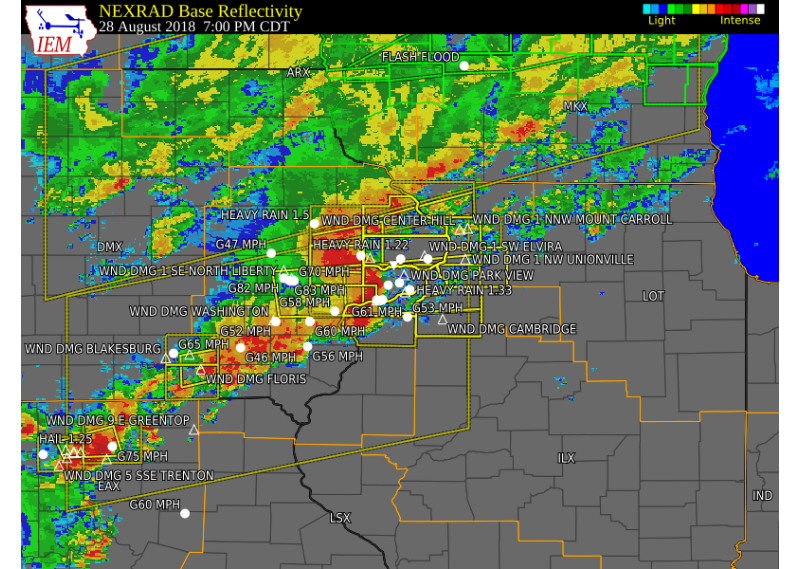
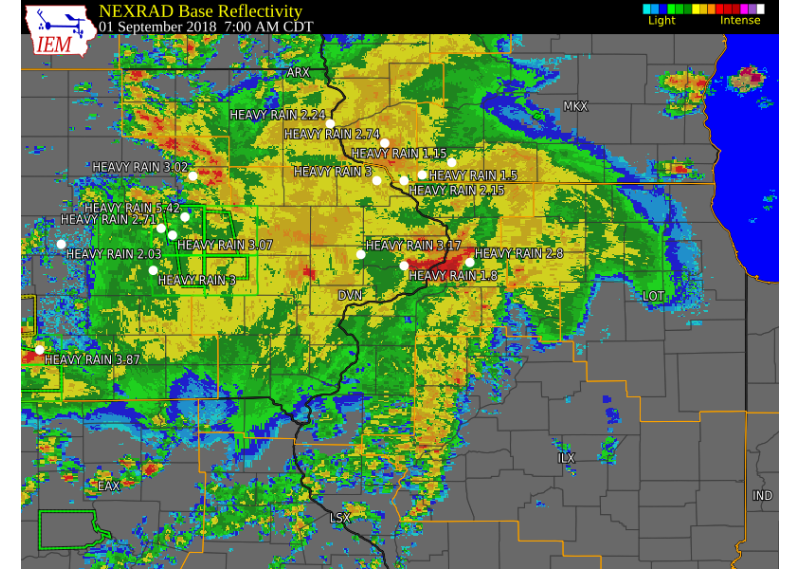
Radar
| Aug 28 - Aug 29th, 2018 | Aug 31 - Sep 9th, 2018 | Early Morning Oct 10th, 2018 |
 |
 |
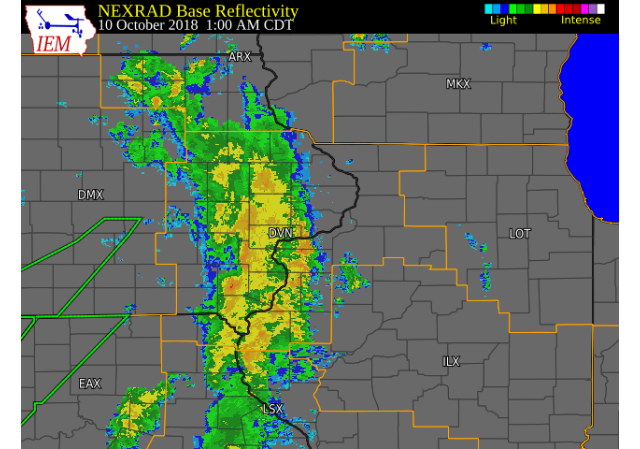 |
| Interactive Radar Loop - Courtesy Iowa Environmental Mesonet | Interactive Radar Loop - Courtesy Iowa Environmental Mesonet | Interactive Radar Loop - Courtesy Iowa Environmental Mesonet |
Rain Reports
| Daily Maps | |||
 |
 |
 |
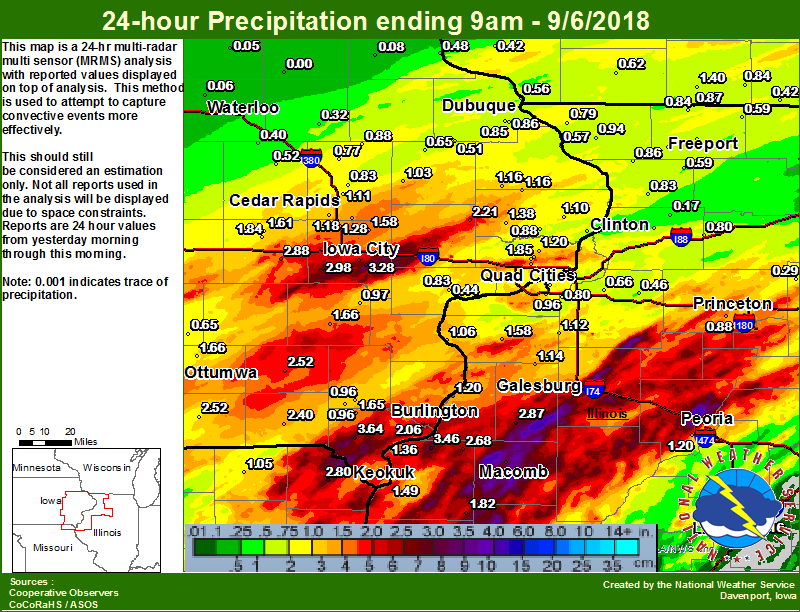 |
| Figure 1: 24hr Precipitation Map Ending 9 am 8/6 | Figure 2: 24hr Precipitation Map Ending 9 am 8/21 | Figure 3: 24hr Precipitation Map Ending 9 am 8/29 | Figure 4: 24hr Precipitation Map Ending 9 am 9/6 |
 |
.png) |
||
| Figure 5: 24hr Precipitation Map Ending 9 am 10/2 | Figure 6: 24hr Precipitation Map Ending 9 am 10/10 | ||
| 7-day Rainfall Maps | |||
 |
 |
||
| Figure 7: 7-day Rainfall Ending September 6th | Figure 8: 7-day Rainfall Ending October 11th | ||
| Monthly Maps | |||
 |
 |
 |
 |
| Figure 9: Observed August Precipitation | Figure 10: Observed September Precipitation | Figure 11: Observed October Precipitation | August-October 2018 Accumulated Precipitation |
Environment
Soil Moisture
 |
 |
 |
| Figure 1: Soil Moisture Ranking Percentile for August 2018 | Figure 2: Soil Moisture Ranking Percentile for September 2018 | Figure 3: Soil Moisture Ranking Percentile for October 2018 |
Streamflow
 |
 |
 |
| Figure 4: Monthly Average Streamflow for August 2018 | Figure 5: Monthly Average Streamflow for September 2018 | Figure 6: Monthly Average Streamflow for October 2018 |
Local Summaries from WFO Quad Cities
Summaries from other NWS Offices
 |
Media use of NWS Web News Stories is encouraged! Please acknowledge the NWS as the source of any news information accessed from this site. |
|

