NOAA/NHC Products | Threats and Impacts | Additional Forecast Info | More Info
 |
Wind Speed ProbabilitiesProbabilities of sustained tropical storm force (39+ mph), storm force (58+ mph) and hurricane force (74+ mph) winds |
 |
Storm Track/Intensity ForecastCone represents the most likely track of the center of the storm NOTE: Impacts can occur outside the cone so don't focus on the exact track! |
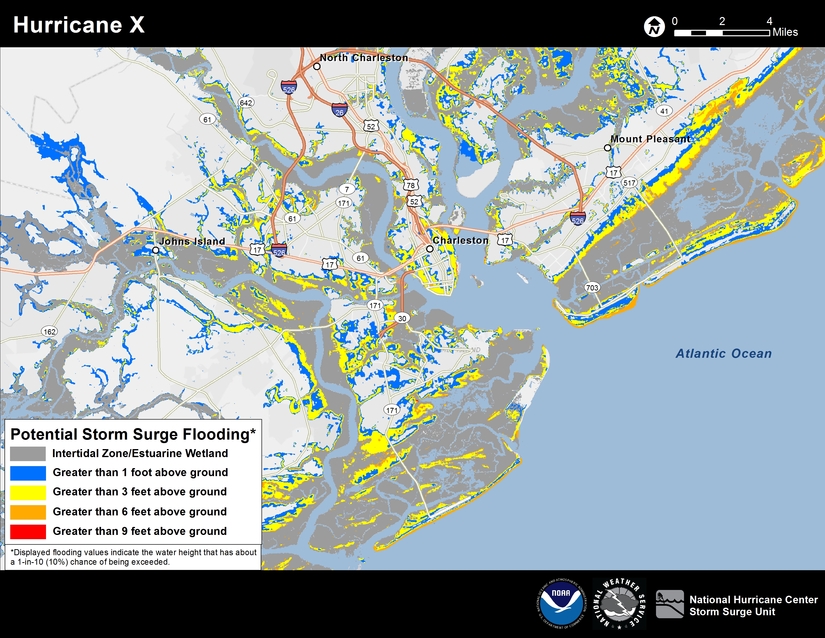 |
Potential Storm Surge Flooding MapAlways represents a reasonable worst-case scenario - what should be prepared for (i.e., depths of inundation which have just a 10% chance of being exceeded) NOTE: Image is an example only - click image for the latest map! |
 |
Satellite ImageryGOES imagery of the Atlantic, Caribbean and Gulf of Mexico tropical regions Visible | Infrared | Water Vapor
|
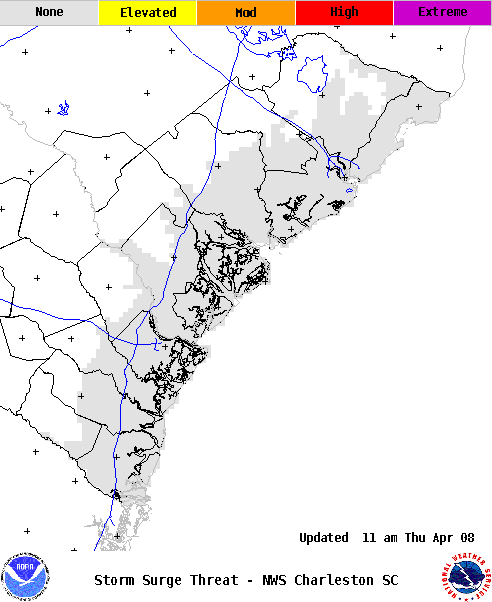
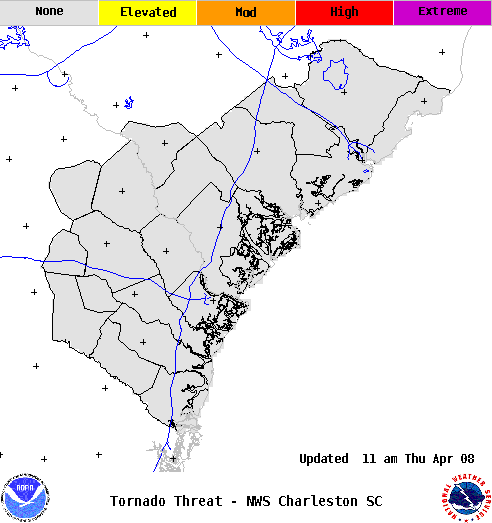
NOTE: Provides information on what you should prepare for regarding winds, storm surge, flooding rain and tornadoes; only available when Tropical Storm, Hurricane and/or Storm Surge Watches/Warnings are in effect for southeast SC/GA
|
|
|
|
|


 Coastal Flood
 Follow us on YouTube