 |
||||||||||
|
2 NEW sets of images hve been posted below! Wednesday May 23rd, 2007 brought a variety of weather to the panhandles. Severe storms began to form just after 4:00 pm in the northeast Texas Panhandle. A few locations northwest of Miami in Roberts County witnessed hail stones up to 2 inches in diameter, and a tornado touchdown around 4:30 pm. Just after 5:00 pm, the wind machine began to crank with thunderstorm wind gusts topping out above 60 mph in southern Roberts County, and again in southern Ochiltree County at 5:30 pm. A storm near Wolf Creek Park in Ochiltree County produced a tornado just before 5:30 pm, and then continued to produce large hail and strong wind gusts through 5:45 pm. Large hail continued to fall cross Ochiltree, Hutchinson, Hansford, Beaver and Lipscomb Counties throuh 7:00 pm with occasional 60 mph wind gusts, and another 3 tornado reports. The severe storms and heavy rain then continued to occur across the northeast Texas Panhandle through the early morning hours on Thursday May 24th. The first report of flash flooding came in just before midnight, but the widespread flooding began shortly after 1:00 am on the 24th. Up to 1 foot of rain fell in some areas, with widespread rain amounts in the 8 to 10 inch range! |
||||||||||
| So what caused this mixed bag of weather? Well, the image above depicts the synoptic pattern in place during the event. A large low pressure trough was dipping down through Colorado and New Mexico along the Rocky Mountains. This provided a southwest component to the winds in the upper atmosphere, and created a source of lift that helped sustain the thunderstorms. Also in place was a very slow moving warm front (shown as a red line with half circle bumps). This warm front was the main feature that served as a source for storm initiation. However, you need more than a warm front to cause storms. You may notice in the above image two lines loosely depicting the "isodrosotherms" (or a line of equal dew point). The purple line shows the 55 degree isodrosotherm with the teal line indicating the 65 degree isodrosotherm. For instance, 65 degree dew points occured along and to all points east of the teal line, with 55 degree and above dew points occuring along and east of the purple line. The key is to note that there was a very high amount of moisture in the air. A general rule of thumb you can remember is that when the dew point temperatures reach 65 degrees or more, then thunderstorms often occur. Many times these thunderstorms are strong and can occasionaly produce tornadoes. One other factor that helped produce the lingering heavy rain and lead to the eventually flooding was the cold front moving toward the panhandles from the north. This front reached the northwestern Texas Panhandle in the late evening on the 23rd, and helped continue storm formation into the early morning hours on the 24th. |
 |
|||||||||
 |
||||||||||
| The image above is a screen capture of a 3 hour precipitation estimate from the WSR 88D Radar. The blue blocks indicate 4 to 6 inches of precipitation occuring during that 3 hour period (9:00 pm to Midnight). Note the relative position of the warm front from the synoptic map (top right) and the matching band of heavy precipitation on this radar image. Remember, this is just a 3 hour estimate. 4 to 6 inches of rain in 3 hours can cause significant flooding issues. |
||||||||||
 |
 |
|||||||||
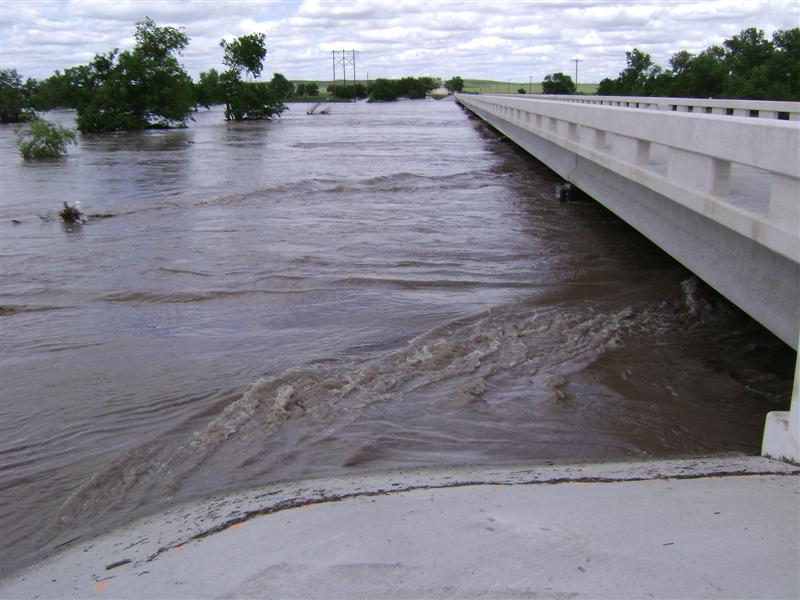
| The image above shows some of the flooding from areas in northern Lipscomb County. The bridge in the above image is along highway 305 in Lipscomb County. | This picture was taken near Wolf Creek Park. The brief touch down of a tornado can be seen. | |||||||||
 |
||||||||||
| This image was taken by Tracy Meier from the storm damage in Lipscomb County. | ||||||||||

