The New Year’s Day Snowstorm of 1964 and How It Affected the Tennessee Valley
Mark A. Rose
National Weather Service, Old Hickory, Tennessee
Timothy W. Troutman
National Weather Service, Huntsville, Alabama
ABSTRACT
A record-setting snowstorm struck the Tennessee Valley on New Year's Eve and early New Year's Day, 1964. The magnitude of the event was underestimated, and made a significant impact on the residents of southern Middle Tennessee and northern Alabama. Meteorological data leading up to and during the event are analyzed here. Snowfall records that were set in many locations still stand now, fifty years later.
I. Introduction
During the evening of December 31, 1963 and early the following morning, a massive winter storm struck the Tennessee Valley (northern Alabama and southern Middle Tennessee), producing snowfall in such abundance that all-time accumulation records were set in several locations that have not been surpassed even now, a half-century later.
In hindsight, the record-setting storm may have been poorly forecast, prompting The Pulaski Citizen to quip, "The snow left weathermen embarrassed, as they were caught with their readings' down; it had not been in the forecast."
This paper will examine the meteorological circumstances of this historic winter storm, as well as the impact of the event on those places whose citizens found themselves digging out from underneath a volume of snow many had not experienced before, nor have experienced since.
II. The Meteorology
The surface weather map at 0700 UTC on December 31, 1963 (Fig. 1) showed a developing low pressure system over the Gulf of Mexico, with a trough extending northward from the low into the Appalachian Mountains. A broad area of high pressure centered over the Great Lakes and northeast U.S. was the dominant feature over most of the eastern U.S., and this helped the flow across the Tennessee Valley turn northeasterly.
Meanwhile, the surface map twelve hours later (Fig. 2) showed the aforementioned surface low having shifted to near Florida's west coast, with a strong surface high still anchored over the northeast. Moisture continued to spread into the southeast U.S. from the frontal system.
The atmospheric sounding taken at Nashville, Tennessee (KBNA), 0000 UTC on 1 January 1964 (Fig. 3), already showed that the atmosphere was entirely below freezing, with the atmosphere nearly saturated throughout the 800-500 mb layer, and drier air in the lower levels. Precipitable water at this time was 0.48 inches, with the top of the saturation layer corresponding to -20oC (The latter is significant because moisture introduced into air colder than -10oC tends to be all ice, as opposed to supercooled water droplets in air that is between 0oC and -10oC.).
At the same time, the 500 mb analysis (Fig. 4) showed a deep, closed low having formed along the Mississippi coast. A second, weaker closed low could be seen over Arkansas. The -20oC isotherm plunged from the southern edge of Hudson Bay southward into the Gulf of Mexico, indicating the remarkable cold air advection associated with this system.
By 0600 UTC on 1 January (Fig. 5), the surface low had turned northeastward to the Carolina coast. Obviously, the Tennessee Valley remained entirely on the cold side of this system, with moisture having spread westward to the Tennessee River and covering much of the southeast U.S.
By 1200 UTC on 1 January at BNA, the entire atmosphere below 600 mb was saturated, with the top of the saturation layer still at -13oC (Fig. 6). Despite the saturation that had occurred in the boundary layer, precipitable water values had decreased slightly to 0.42 inches, due mainly to dry advection in the mid-levels. Thus, this time, most of the snowfall across the Tennessee Valley had already occurred, although accumulating snow was still falling at many locations (Huntsville had officially measured 11 inches of snow by 1200 UTC, and would receive an additional 6.1 inches, setting an all-time record of 17.1 inches.).
III. Impacts
The Huntsville Times accurately proclaimed the north Alabama city "the nation's top snow-getter for New Year." Indeed, Huntsville, Alabama’s 17.1-inch snowfall on January 1, 1964 gave the city the distinction of measuring more snowfall that day than any other U.S. weather station (NWS Huntsville). Unofficially, nearly 20 inches were measured in the Muscle Shoals/Florence area of northwest Alabama (Connor et al. 1973).
Farther north, The Pulaski Citizen noted that, "The storm, which dumped four inches of snow on New Orleans earlier in the day, hit Pulaski about 3 o'clock in the afternoon [of December 31]. By 5 p.m., only a half-inch had come down, but after that the wind got stronger and the flakes larger and by the wee hours of Wednesday morning there was a foot of snow covering the county. The wind-swept snow drifted over knee-deep in places. There was some sleet mixed with the falling snow at times."
Pulaski officially measured 11.5 inches of snow that day, which remains the single-day record snowfall for that city (with records beginning there in 1949). Situated one county west of Pulaski, Lawrenceburg, Tennessee nearly equaled Huntsville's snowfall total with 16.0 inches of accumulation, which remains the all-time record snowfall for that city (with records also beginning in 1949).
The following day, January 2, The Democrat Union (Lawrenceburg) observed, "Had a similar precipitation been in the form of rainfall, it might have been characterized as a 'flash flood.' Perhaps this unprecedented snowfall could be called a 'flash snow,' it fell so rapidly and so quickly paralyzed movement of traffic as well as pedestrians."
One county west of Lawrenceburg, Waynesboro measured 15.5 inches of accumulation, which also remains the record snowfall there, with records dating back to 1891. Oddly, The Wayne County Times on January 3 (the first publication since the snowstorm) had very little to say about the event, concluding a three-paragraph article with the following: "Altho [sic] the roads and streets have been snow and ice covered, and few wrecks and no fatalities have been reported in the county. Many say it was the quietest New Year's holiday season in many, many years."
Several other Middle Tennessee locations around the Tennessee Valley also set daily snowfall records that still exist 50 years later: Bethpage (7.0 inches), Centerville (11.0), Columbia (15.0), Fayetteville (11.0), Lebanon (10.0), Lewisburg (12.5), Linden (10.0), Mt. Pleasant (15.0), Neapolis/Spring Hill (11.0), Old Hickory Dam (10.0), and Shelbyville (9.0). While Nashville did not set a daily (midnight-to-midnight) record, the city did measure 10.2 inches of accumulation that spanned two calendar days, making the New Year’s Day 1964 event the 3rd greatest snowstorm in the city's history.
IV. Conclusions
It is virtually impossible to know now, fifty years later, why forecasters missed the enormous snowfall totals that occurred with the New Year's Day 1964 event. Obviously, computer technology and atmospheric models have made great advances during the half-century that spans that event to the present day.
Still, one must be curious what techniques and "rules of thumb" were used by forecasters during that era. It is possible that forecasters simply believed the storm system was too far south to produce any meaningful snowfall across the Tennessee Valley at that time.
Judging by the anecdotes contained in newspaper articles following the storm, it seems that residents of the Tennessee Valley handled the record snowfall with amazingly few hardships. One can only wonder how today's Tennessee Valley residents would endure such an event, especially given the lull in snowfall over the last decade and our own relative inexperience in maneuvering through such a volume of snow.
Acknowledgements
The authors offer their thanks to Angela Lese and Darrell Massie, NWS Old Hickory, and Dan Dixon, Brian Carcione, and Christina Crowe, NWS Huntsville, for their reviews of this manuscript. We also thank to Kurt Weber, NWS Huntsville, for providing the snowfall map that appears in Fig. 8, and Bobby Boyd, NWS Old Hickory, for providing the surface observations that appear in Appendix 1.
50th Anniversary of the New Year's 1963/1964 Snowstorm. National Weather Service Huntsville, AL.
Blizzard Christens New Year With 12-Inch Snow. The Pulaski Citizen. January 1, 1964.
Connor, W. Clyde, Kenneth C. Crawford, and Eulah L. Hill, 1973: Snow Forecasting in the South: Occasional Blizzards over the Southern Plains to Rare Gulf Coast Snows, Weatherwise, Vol. 26, No. 6.
Fifteen Inch Snow Shatters Record Set In 1929 According To Local Weather Prognosticator. The Wayne County Times. January 3, 1964.
New Year's Eve 1963 Snowstorm. Wikipedia.
NOAA Central Library, U.S. Daily Weather Maps Project.
Plymouth State Weather Center RAOB Thermodynamic Diagram/Data.
Schaub, William R., Jr., 2004: The Huntsville, Alabama Snowstorm of December 31, 1963: A Brief Review. Forecasting Note.
Snow Up To 16 Inches; Second Blast Of Season. The Democrat Union (Lawrenceburg, Tennessee). January 2, 1964.

Fig. 1. Daily Weather Map valid 0600 UTC on 31 December 1963 (upper left, click to expand) (Source: NOAA Central Library, U.S. Daily Weather Maps Project).
Fig. 2. Daily Weather Map valid 1800 UTC on 31 December 1963 (upper right, click to expand).

Fig. 3. Atmospheric sounding from KBNA taken at 0000 UTC on 1 January 1964 (Source: Plymouth State Weather Center). The 0o isotherm is highlighted in blue.

Fig. 4. 500 mb analysis valid at 0000 UTC on 1 January 1964 (bottom left, click to expand).
Fig. 5. Surface map valid at 0600 UTC on 1 January 1964 (upper left, click to expand).

Fig. 6. Atmospheric sounding taken at KBNA, 1200 UTC on 1 January 1964. The 0o isotherm is highlighted in blue.

Fig. 7. Snowstorm aftermath at the University of the South at Sewanee, Tennessee. (Photo courtesy of the University of the South.)

Fig. 8. Snowfall amounts across the southeast U.S.
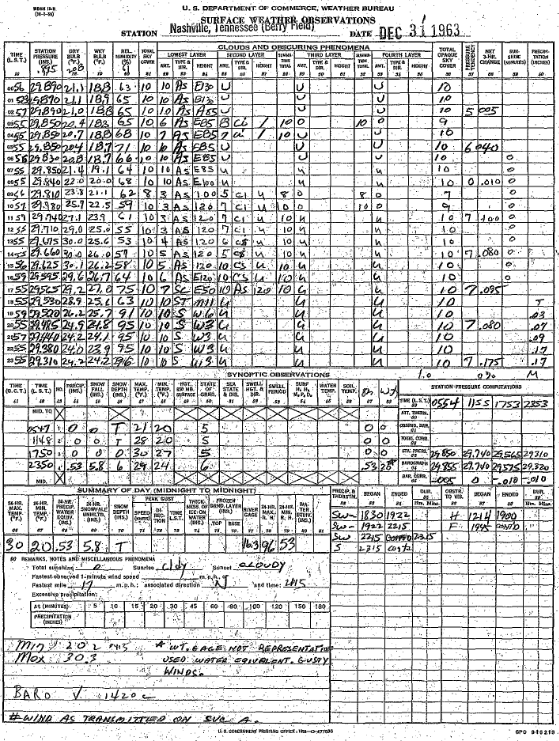
Appendix 1. Nashville surface observations on December 31, 1963 and January 1, 1964.


 Follow us on YouTube